Yakama vs Immigrants from Somalia Doctorate Degree
COMPARE
Yakama
Immigrants from Somalia
Doctorate Degree
Doctorate Degree Comparison
Yakama
Immigrants from Somalia
1.3%
DOCTORATE DEGREE
0.0/ 100
METRIC RATING
332nd/ 347
METRIC RANK
1.8%
DOCTORATE DEGREE
25.4/ 100
METRIC RATING
195th/ 347
METRIC RANK
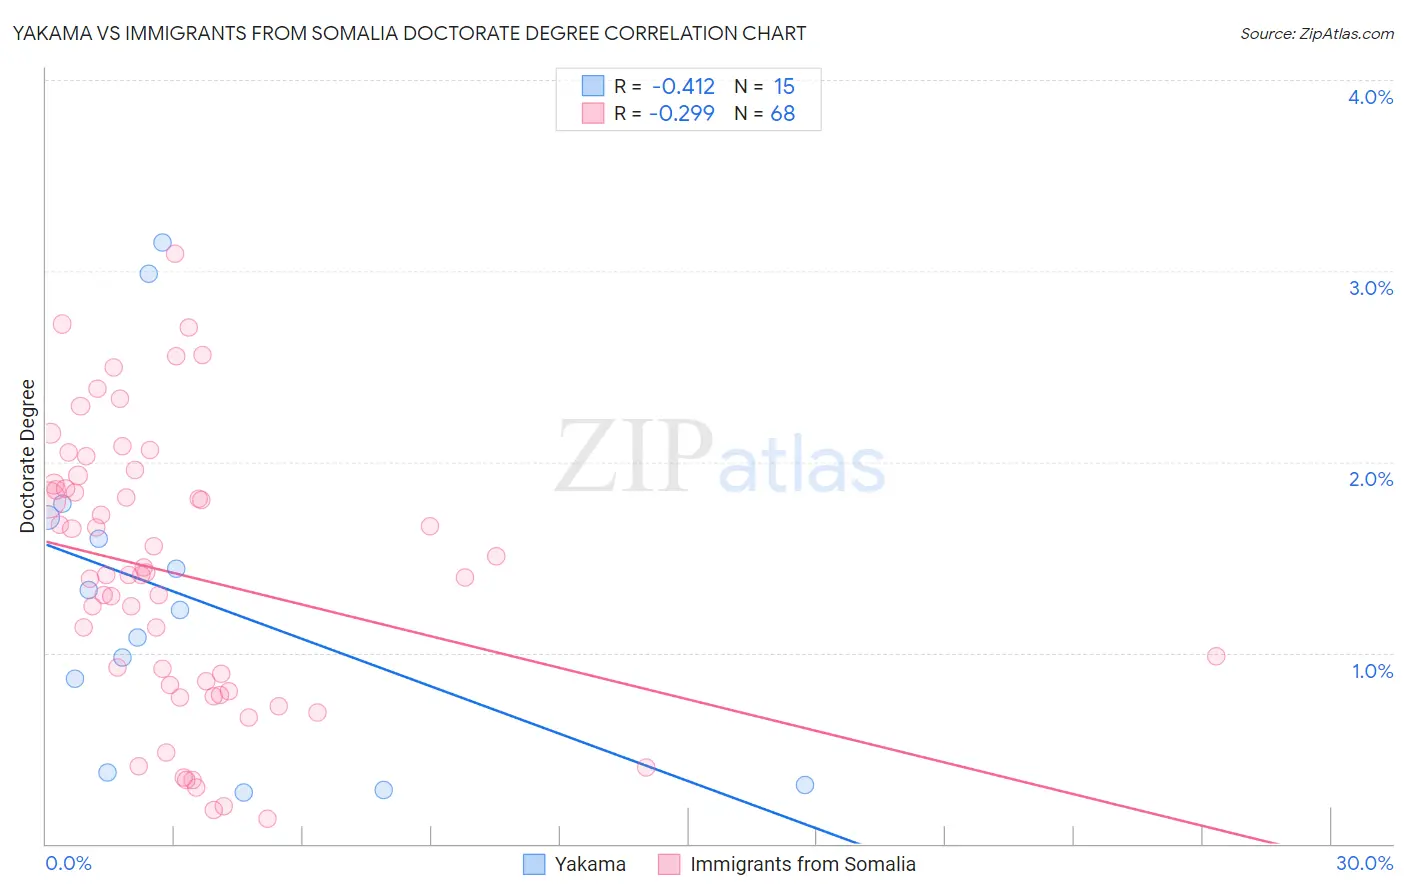
Yakama vs Immigrants from Somalia Doctorate Degree Correlation Chart
The statistical analysis conducted on geographies consisting of 19,742,770 people shows a moderate negative correlation between the proportion of Yakama and percentage of population with at least doctorate degree education in the United States with a correlation coefficient (R) of -0.412 and weighted average of 1.3%. Similarly, the statistical analysis conducted on geographies consisting of 91,934,011 people shows a weak negative correlation between the proportion of Immigrants from Somalia and percentage of population with at least doctorate degree education in the United States with a correlation coefficient (R) of -0.299 and weighted average of 1.8%, a difference of 37.6%.
Doctorate Degree Correlation Summary
| Measurement | Yakama | Immigrants from Somalia |
| Minimum | 0.27% | 0.13% |
| Maximum | 3.1% | 3.1% |
| Range | 2.9% | 3.0% |
| Mean | 1.3% | 1.4% |
| Median | 1.2% | 1.4% |
| Interquartile 25% (IQ1) | 0.37% | 0.82% |
| Interquartile 75% (IQ3) | 1.7% | 1.9% |
| Interquartile Range (IQR) | 1.3% | 1.1% |
| Standard Deviation (Sample) | 0.89% | 0.72% |
| Standard Deviation (Population) | 0.86% | 0.71% |
Similar Demographics by Doctorate Degree
Demographics Similar to Yakama by Doctorate Degree
In terms of doctorate degree, the demographic groups most similar to Yakama are Immigrants from Caribbean (1.3%, a difference of 0.16%), Immigrants from Dominican Republic (1.3%, a difference of 0.35%), Immigrants from Latin America (1.3%, a difference of 1.6%), Yup'ik (1.3%, a difference of 1.6%), and Haitian (1.3%, a difference of 1.8%).
| Demographics | Rating | Rank | Doctorate Degree |
| Pima | 0.0 /100 | #325 | Tragic 1.3% |
| Immigrants | Cabo Verde | 0.0 /100 | #326 | Tragic 1.3% |
| Hispanics or Latinos | 0.0 /100 | #327 | Tragic 1.3% |
| Inupiat | 0.0 /100 | #328 | Tragic 1.3% |
| Haitians | 0.0 /100 | #329 | Tragic 1.3% |
| Yup'ik | 0.0 /100 | #330 | Tragic 1.3% |
| Immigrants | Latin America | 0.0 /100 | #331 | Tragic 1.3% |
| Yakama | 0.0 /100 | #332 | Tragic 1.3% |
| Immigrants | Caribbean | 0.0 /100 | #333 | Tragic 1.3% |
| Immigrants | Dominican Republic | 0.0 /100 | #334 | Tragic 1.3% |
| Immigrants | Haiti | 0.0 /100 | #335 | Tragic 1.3% |
| Nepalese | 0.0 /100 | #336 | Tragic 1.3% |
| Bangladeshis | 0.0 /100 | #337 | Tragic 1.2% |
| Puget Sound Salish | 0.0 /100 | #338 | Tragic 1.2% |
| Immigrants | Central America | 0.0 /100 | #339 | Tragic 1.2% |
Demographics Similar to Immigrants from Somalia by Doctorate Degree
In terms of doctorate degree, the demographic groups most similar to Immigrants from Somalia are Subsaharan African (1.8%, a difference of 0.070%), Chinese (1.8%, a difference of 0.070%), Uruguayan (1.8%, a difference of 0.15%), Immigrants from Ghana (1.8%, a difference of 0.16%), and German Russian (1.8%, a difference of 0.33%).
| Demographics | Rating | Rank | Doctorate Degree |
| Germans | 30.5 /100 | #188 | Fair 1.8% |
| French Canadians | 30.2 /100 | #189 | Fair 1.8% |
| Immigrants | Costa Rica | 30.2 /100 | #190 | Fair 1.8% |
| South Americans | 29.5 /100 | #191 | Fair 1.8% |
| Dutch | 27.4 /100 | #192 | Fair 1.8% |
| German Russians | 27.1 /100 | #193 | Fair 1.8% |
| Uruguayans | 26.2 /100 | #194 | Fair 1.8% |
| Immigrants | Somalia | 25.4 /100 | #195 | Fair 1.8% |
| Sub-Saharan Africans | 25.1 /100 | #196 | Fair 1.8% |
| Chinese | 25.1 /100 | #197 | Fair 1.8% |
| Immigrants | Ghana | 24.6 /100 | #198 | Fair 1.8% |
| Immigrants | South America | 23.3 /100 | #199 | Fair 1.8% |
| Whites/Caucasians | 22.8 /100 | #200 | Fair 1.8% |
| Immigrants | Nigeria | 22.4 /100 | #201 | Fair 1.8% |
| Portuguese | 21.4 /100 | #202 | Fair 1.8% |