White/Caucasian vs Immigrants from Zaire In Labor Force | Age > 16
COMPARE
White/Caucasian
Immigrants from Zaire
In Labor Force | Age > 16
In Labor Force | Age > 16 Comparison
Whites/Caucasians
Immigrants from Zaire
63.6%
IN LABOR FORCE | AGE > 16
0.0/ 100
METRIC RATING
299th/ 347
METRIC RANK
67.2%
IN LABOR FORCE | AGE > 16
100.0/ 100
METRIC RATING
30th/ 347
METRIC RANK
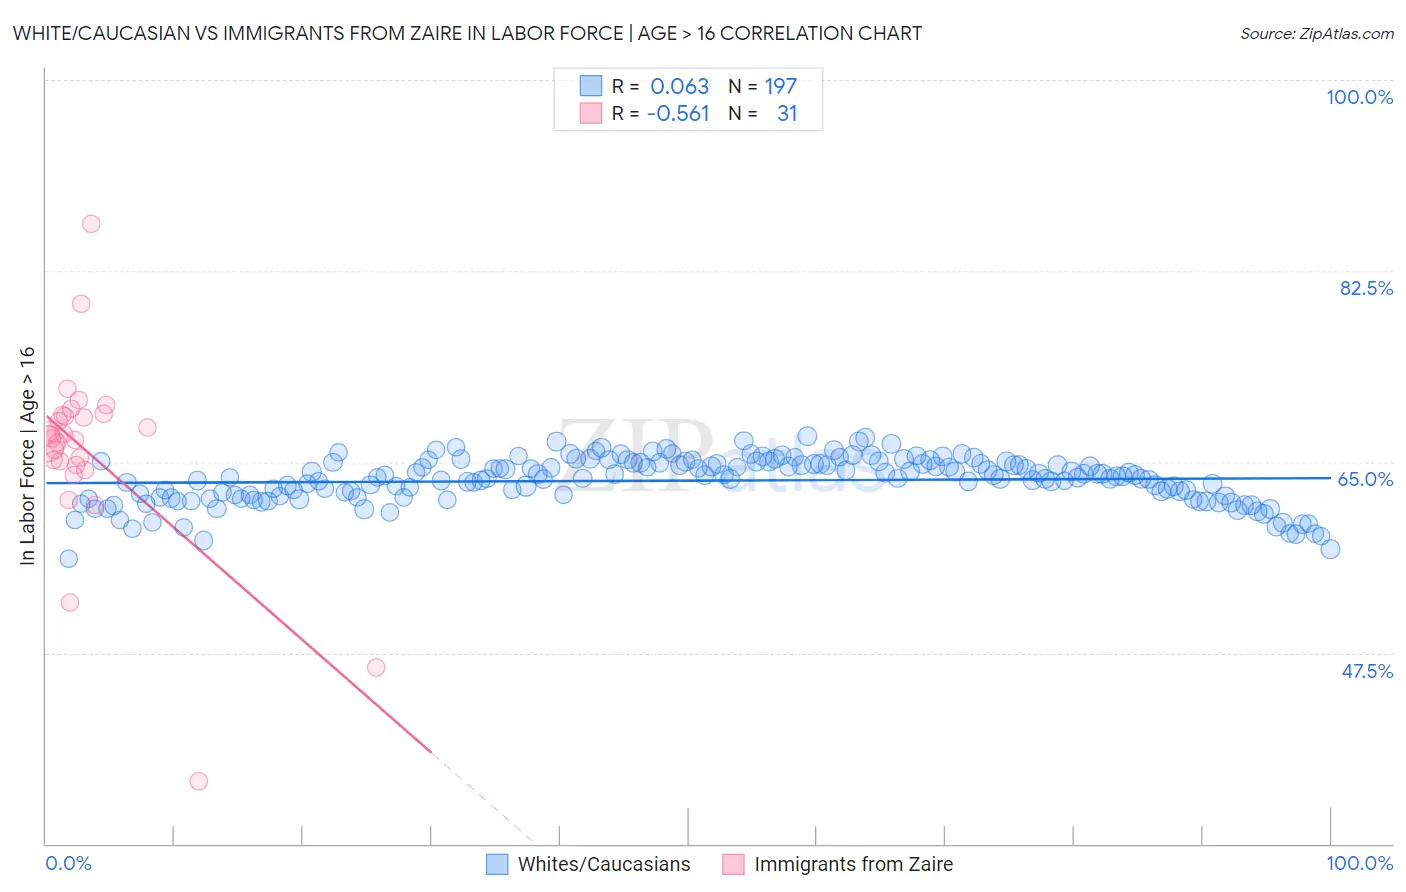
White/Caucasian vs Immigrants from Zaire In Labor Force | Age > 16 Correlation Chart
The statistical analysis conducted on geographies consisting of 584,901,305 people shows a slight positive correlation between the proportion of Whites/Caucasians and labor force participation rate among population ages 16 and over in the United States with a correlation coefficient (R) of 0.063 and weighted average of 63.6%. Similarly, the statistical analysis conducted on geographies consisting of 107,255,436 people shows a substantial negative correlation between the proportion of Immigrants from Zaire and labor force participation rate among population ages 16 and over in the United States with a correlation coefficient (R) of -0.561 and weighted average of 67.2%, a difference of 5.7%.
In Labor Force | Age > 16 Correlation Summary
| Measurement | White/Caucasian | Immigrants from Zaire |
| Minimum | 56.1% | 35.7% |
| Maximum | 67.3% | 86.8% |
| Range | 11.3% | 51.1% |
| Mean | 63.3% | 65.9% |
| Median | 63.6% | 67.2% |
| Interquartile 25% (IQ1) | 61.8% | 64.7% |
| Interquartile 75% (IQ3) | 64.9% | 69.3% |
| Interquartile Range (IQR) | 3.1% | 4.6% |
| Standard Deviation (Sample) | 2.1% | 8.8% |
| Standard Deviation (Population) | 2.1% | 8.7% |
Similar Demographics by In Labor Force | Age > 16
Demographics Similar to Whites/Caucasians by In Labor Force | Age > 16
In terms of in labor force | age > 16, the demographic groups most similar to Whites/Caucasians are Immigrants from the Azores (63.6%, a difference of 0.010%), Spanish American (63.6%, a difference of 0.030%), Delaware (63.6%, a difference of 0.050%), Immigrants from Grenada (63.6%, a difference of 0.060%), and Comanche (63.6%, a difference of 0.060%).
| Demographics | Rating | Rank | In Labor Force | Age > 16 |
| Spanish American Indians | 0.1 /100 | #292 | Tragic 63.8% |
| English | 0.1 /100 | #293 | Tragic 63.7% |
| Puget Sound Salish | 0.0 /100 | #294 | Tragic 63.7% |
| Immigrants | Canada | 0.0 /100 | #295 | Tragic 63.7% |
| Immigrants | North America | 0.0 /100 | #296 | Tragic 63.7% |
| Immigrants | Grenada | 0.0 /100 | #297 | Tragic 63.6% |
| Comanche | 0.0 /100 | #298 | Tragic 63.6% |
| Whites/Caucasians | 0.0 /100 | #299 | Tragic 63.6% |
| Immigrants | Azores | 0.0 /100 | #300 | Tragic 63.6% |
| Spanish Americans | 0.0 /100 | #301 | Tragic 63.6% |
| Delaware | 0.0 /100 | #302 | Tragic 63.6% |
| Cree | 0.0 /100 | #303 | Tragic 63.5% |
| Immigrants | Nonimmigrants | 0.0 /100 | #304 | Tragic 63.5% |
| Osage | 0.0 /100 | #305 | Tragic 63.5% |
| Blacks/African Americans | 0.0 /100 | #306 | Tragic 63.4% |
Demographics Similar to Immigrants from Zaire by In Labor Force | Age > 16
In terms of in labor force | age > 16, the demographic groups most similar to Immigrants from Zaire are Thai (67.2%, a difference of 0.010%), Immigrants from Morocco (67.2%, a difference of 0.040%), Ghanaian (67.1%, a difference of 0.10%), Zimbabwean (67.3%, a difference of 0.12%), and Immigrants from Congo (67.1%, a difference of 0.16%).
| Demographics | Rating | Rank | In Labor Force | Age > 16 |
| Cambodians | 100.0 /100 | #23 | Exceptional 67.4% |
| Ugandans | 100.0 /100 | #24 | Exceptional 67.4% |
| Immigrants | Africa | 100.0 /100 | #25 | Exceptional 67.4% |
| Immigrants | Cabo Verde | 100.0 /100 | #26 | Exceptional 67.3% |
| Zimbabweans | 100.0 /100 | #27 | Exceptional 67.3% |
| Immigrants | Morocco | 100.0 /100 | #28 | Exceptional 67.2% |
| Thais | 100.0 /100 | #29 | Exceptional 67.2% |
| Immigrants | Zaire | 100.0 /100 | #30 | Exceptional 67.2% |
| Ghanaians | 100.0 /100 | #31 | Exceptional 67.1% |
| Immigrants | Congo | 100.0 /100 | #32 | Exceptional 67.1% |
| Afghans | 100.0 /100 | #33 | Exceptional 67.1% |
| Immigrants | Ghana | 100.0 /100 | #34 | Exceptional 67.1% |
| Immigrants | South Central Asia | 100.0 /100 | #35 | Exceptional 67.1% |
| Immigrants | Western Africa | 100.0 /100 | #36 | Exceptional 67.1% |
| Immigrants | Afghanistan | 100.0 /100 | #37 | Exceptional 67.0% |