White/Caucasian vs Slovak Master's Degree
COMPARE
White/Caucasian
Slovak
Master's Degree
Master's Degree Comparison
Whites/Caucasians
Slovaks
13.8%
MASTER'S DEGREE
9.1/ 100
METRIC RATING
228th/ 347
METRIC RANK
14.9%
MASTER'S DEGREE
50.0/ 100
METRIC RATING
174th/ 347
METRIC RANK
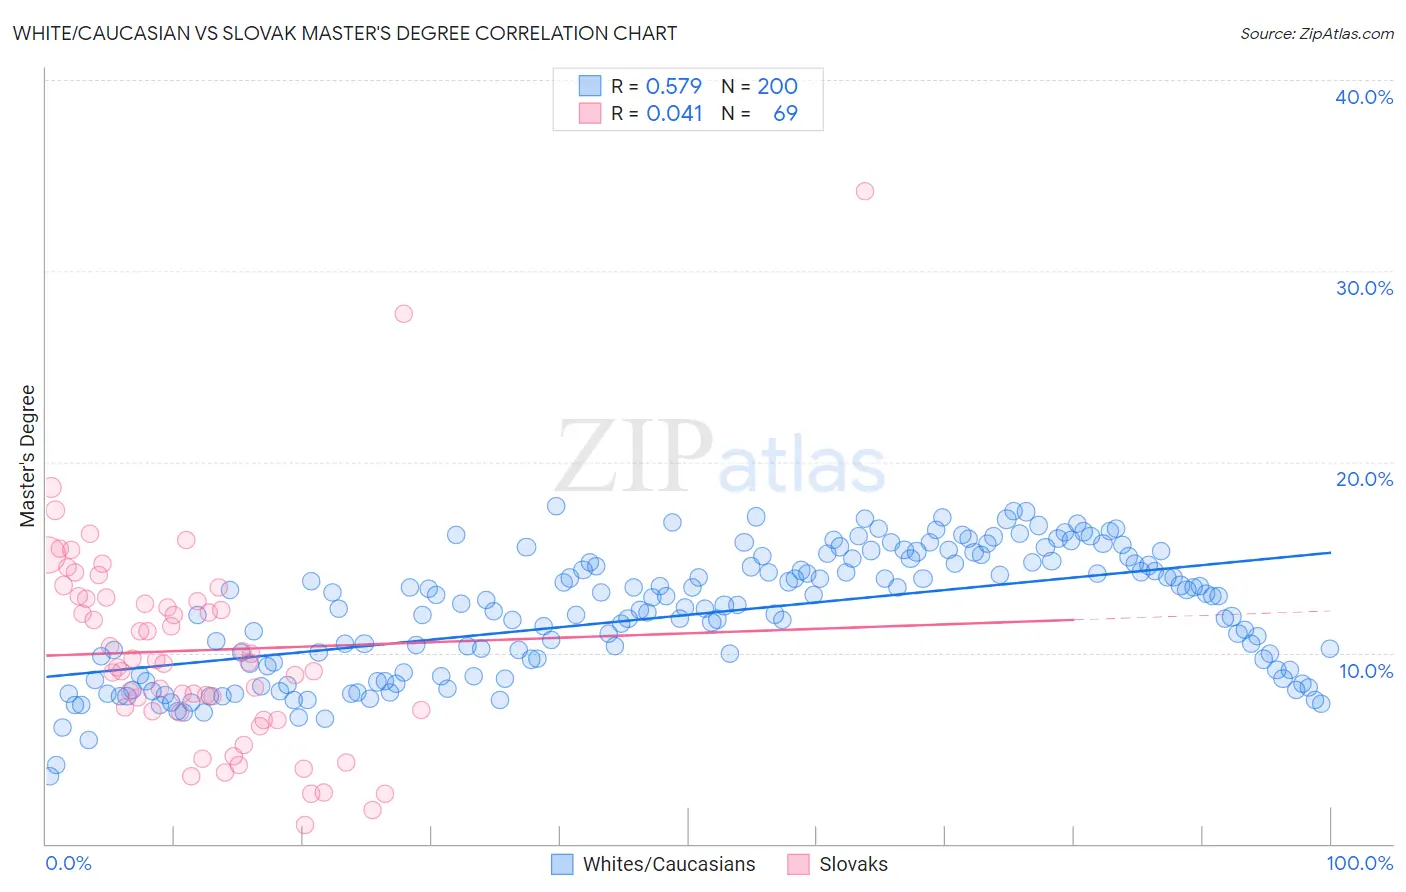
White/Caucasian vs Slovak Master's Degree Correlation Chart
The statistical analysis conducted on geographies consisting of 583,022,214 people shows a substantial positive correlation between the proportion of Whites/Caucasians and percentage of population with at least master's degree education in the United States with a correlation coefficient (R) of 0.579 and weighted average of 13.8%. Similarly, the statistical analysis conducted on geographies consisting of 397,752,866 people shows no correlation between the proportion of Slovaks and percentage of population with at least master's degree education in the United States with a correlation coefficient (R) of 0.041 and weighted average of 14.9%, a difference of 8.0%.
Master's Degree Correlation Summary
| Measurement | White/Caucasian | Slovak |
| Minimum | 3.5% | 1.0% |
| Maximum | 17.7% | 34.2% |
| Range | 14.2% | 33.1% |
| Mean | 12.0% | 10.1% |
| Median | 12.3% | 9.5% |
| Interquartile 25% (IQ1) | 8.9% | 6.9% |
| Interquartile 75% (IQ3) | 14.7% | 12.8% |
| Interquartile Range (IQR) | 5.8% | 5.9% |
| Standard Deviation (Sample) | 3.2% | 5.5% |
| Standard Deviation (Population) | 3.2% | 5.5% |
Similar Demographics by Master's Degree
Demographics Similar to Whites/Caucasians by Master's Degree
In terms of master's degree, the demographic groups most similar to Whites/Caucasians are British West Indian (13.8%, a difference of 0.10%), Dutch (13.8%, a difference of 0.14%), Immigrants from West Indies (13.9%, a difference of 0.31%), Guyanese (13.7%, a difference of 0.68%), and Immigrants from St. Vincent and the Grenadines (13.9%, a difference of 0.76%).
| Demographics | Rating | Rank | Master's Degree |
| Koreans | 12.7 /100 | #221 | Poor 14.0% |
| Ecuadorians | 12.6 /100 | #222 | Poor 14.0% |
| Immigrants | South Eastern Asia | 11.9 /100 | #223 | Poor 14.0% |
| Immigrants | Grenada | 11.8 /100 | #224 | Poor 14.0% |
| Portuguese | 11.2 /100 | #225 | Poor 13.9% |
| Immigrants | St. Vincent and the Grenadines | 11.0 /100 | #226 | Poor 13.9% |
| Immigrants | West Indies | 9.8 /100 | #227 | Tragic 13.9% |
| Whites/Caucasians | 9.1 /100 | #228 | Tragic 13.8% |
| British West Indians | 8.8 /100 | #229 | Tragic 13.8% |
| Dutch | 8.7 /100 | #230 | Tragic 13.8% |
| Guyanese | 7.6 /100 | #231 | Tragic 13.7% |
| Immigrants | Philippines | 6.0 /100 | #232 | Tragic 13.6% |
| Immigrants | Ecuador | 5.7 /100 | #233 | Tragic 13.6% |
| Immigrants | Burma/Myanmar | 5.0 /100 | #234 | Tragic 13.5% |
| German Russians | 4.5 /100 | #235 | Tragic 13.5% |
Demographics Similar to Slovaks by Master's Degree
In terms of master's degree, the demographic groups most similar to Slovaks are Immigrants from Peru (14.9%, a difference of 0.050%), Nigerian (14.9%, a difference of 0.18%), Immigrants from Colombia (14.9%, a difference of 0.21%), Costa Rican (15.0%, a difference of 0.32%), and Immigrants from Uruguay (15.0%, a difference of 0.36%).
| Demographics | Rating | Rank | Master's Degree |
| Senegalese | 65.6 /100 | #167 | Good 15.2% |
| Immigrants | North Macedonia | 64.5 /100 | #168 | Good 15.2% |
| Scottish | 62.7 /100 | #169 | Good 15.2% |
| Irish | 56.3 /100 | #170 | Average 15.0% |
| Immigrants | Ghana | 53.6 /100 | #171 | Average 15.0% |
| Immigrants | Uruguay | 52.8 /100 | #172 | Average 15.0% |
| Costa Ricans | 52.5 /100 | #173 | Average 15.0% |
| Slovaks | 50.0 /100 | #174 | Average 14.9% |
| Immigrants | Peru | 49.6 /100 | #175 | Average 14.9% |
| Nigerians | 48.6 /100 | #176 | Average 14.9% |
| Immigrants | Colombia | 48.3 /100 | #177 | Average 14.9% |
| English | 45.0 /100 | #178 | Average 14.8% |
| Immigrants | Iraq | 41.3 /100 | #179 | Average 14.8% |
| Celtics | 41.3 /100 | #180 | Average 14.8% |
| Swiss | 41.1 /100 | #181 | Average 14.7% |