West Indian vs Bangladeshi 11th Grade
COMPARE
West Indian
Bangladeshi
11th Grade
11th Grade Comparison
West Indians
Bangladeshis
91.0%
11TH GRADE
0.1/ 100
METRIC RATING
272nd/ 347
METRIC RANK
90.9%
11TH GRADE
0.1/ 100
METRIC RATING
276th/ 347
METRIC RANK
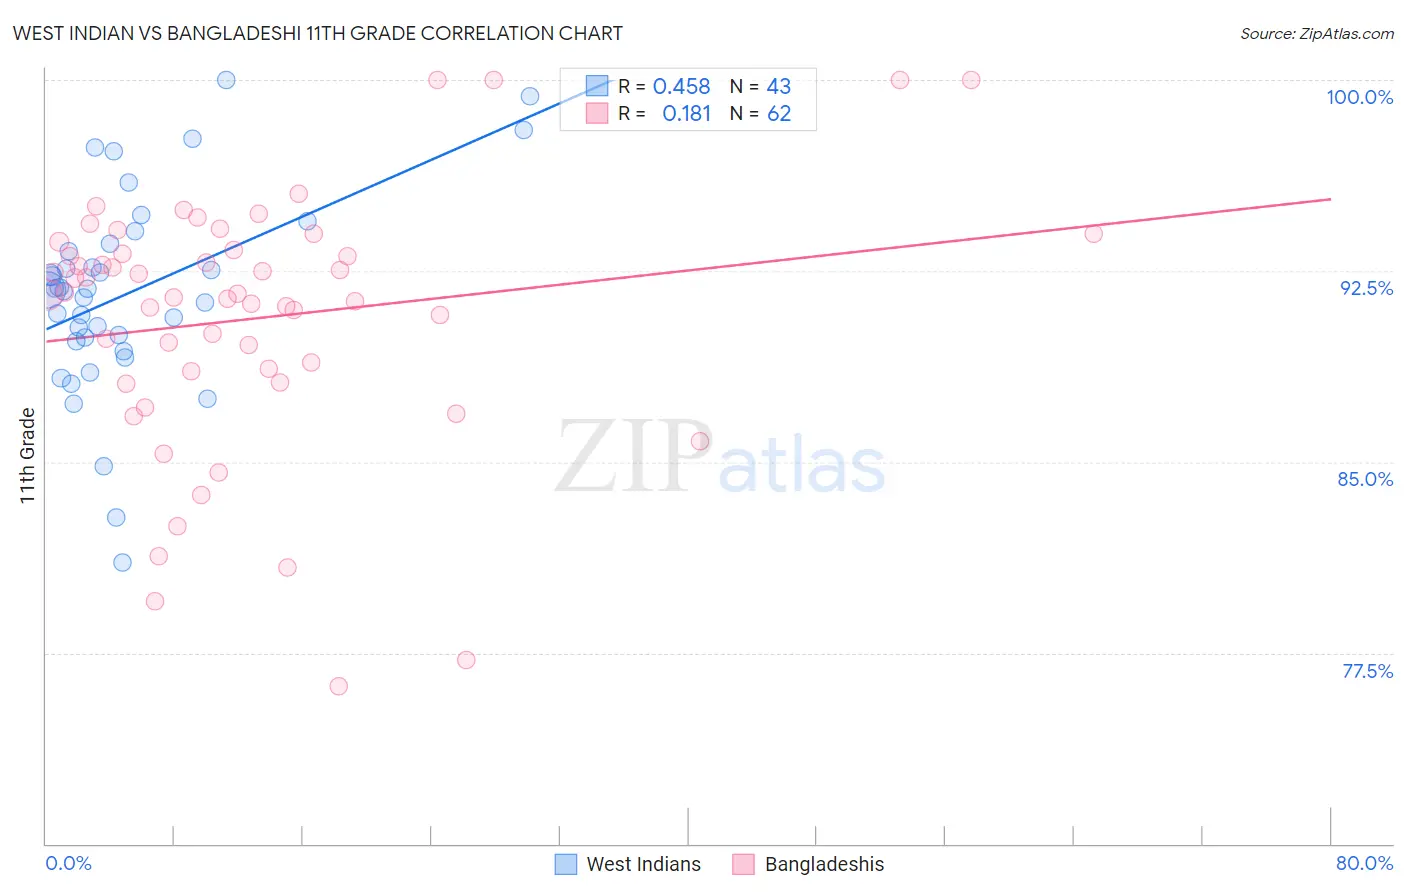
West Indian vs Bangladeshi 11th Grade Correlation Chart
The statistical analysis conducted on geographies consisting of 254,059,006 people shows a moderate positive correlation between the proportion of West Indians and percentage of population with at least 11th grade education in the United States with a correlation coefficient (R) of 0.458 and weighted average of 91.0%. Similarly, the statistical analysis conducted on geographies consisting of 141,450,108 people shows a poor positive correlation between the proportion of Bangladeshis and percentage of population with at least 11th grade education in the United States with a correlation coefficient (R) of 0.181 and weighted average of 90.9%, a difference of 0.17%.
11th Grade Correlation Summary
| Measurement | West Indian | Bangladeshi |
| Minimum | 81.1% | 76.2% |
| Maximum | 100.0% | 100.0% |
| Range | 18.9% | 23.8% |
| Mean | 91.7% | 90.6% |
| Median | 91.7% | 91.6% |
| Interquartile 25% (IQ1) | 89.7% | 88.5% |
| Interquartile 75% (IQ3) | 93.6% | 93.3% |
| Interquartile Range (IQR) | 3.8% | 4.8% |
| Standard Deviation (Sample) | 4.0% | 5.0% |
| Standard Deviation (Population) | 3.9% | 5.0% |
Demographics Similar to West Indians and Bangladeshis by 11th Grade
In terms of 11th grade, the demographic groups most similar to West Indians are Immigrants from Peru (91.0%, a difference of 0.0%), Trinidadian and Tobagonian (91.1%, a difference of 0.040%), Paiute (91.0%, a difference of 0.050%), Ute (91.1%, a difference of 0.060%), and U.S. Virgin Islander (91.1%, a difference of 0.090%). Similarly, the demographic groups most similar to Bangladeshis are Immigrants from Congo (90.9%, a difference of 0.020%), Malaysian (90.8%, a difference of 0.050%), Immigrants from South Eastern Asia (90.9%, a difference of 0.070%), Immigrants from Trinidad and Tobago (90.9%, a difference of 0.080%), and Barbadian (90.8%, a difference of 0.10%).
| Demographics | Rating | Rank | 11th Grade |
| Yup'ik | 0.3 /100 | #264 | Tragic 91.2% |
| Pueblo | 0.3 /100 | #265 | Tragic 91.2% |
| Immigrants | Western Africa | 0.3 /100 | #266 | Tragic 91.2% |
| Immigrants | Jamaica | 0.3 /100 | #267 | Tragic 91.2% |
| U.S. Virgin Islanders | 0.2 /100 | #268 | Tragic 91.1% |
| Ute | 0.2 /100 | #269 | Tragic 91.1% |
| Trinidadians and Tobagonians | 0.2 /100 | #270 | Tragic 91.1% |
| Immigrants | Peru | 0.1 /100 | #271 | Tragic 91.0% |
| West Indians | 0.1 /100 | #272 | Tragic 91.0% |
| Paiute | 0.1 /100 | #273 | Tragic 91.0% |
| Immigrants | Trinidad and Tobago | 0.1 /100 | #274 | Tragic 90.9% |
| Immigrants | South Eastern Asia | 0.1 /100 | #275 | Tragic 90.9% |
| Bangladeshis | 0.1 /100 | #276 | Tragic 90.9% |
| Immigrants | Congo | 0.1 /100 | #277 | Tragic 90.9% |
| Malaysians | 0.1 /100 | #278 | Tragic 90.8% |
| Barbadians | 0.0 /100 | #279 | Tragic 90.8% |
| Sri Lankans | 0.0 /100 | #280 | Tragic 90.7% |
| Dutch West Indians | 0.0 /100 | #281 | Tragic 90.7% |
| Immigrants | St. Vincent and the Grenadines | 0.0 /100 | #282 | Tragic 90.7% |
| Immigrants | Barbados | 0.0 /100 | #283 | Tragic 90.7% |
| Immigrants | Laos | 0.0 /100 | #284 | Tragic 90.5% |