West Indian vs Cuban Hearing Disability
COMPARE
West Indian
Cuban
Hearing Disability
Hearing Disability Comparison
West Indians
Cubans
2.6%
HEARING DISABILITY
99.4/ 100
METRIC RATING
42nd/ 347
METRIC RANK
2.8%
HEARING DISABILITY
89.4/ 100
METRIC RATING
121st/ 347
METRIC RANK
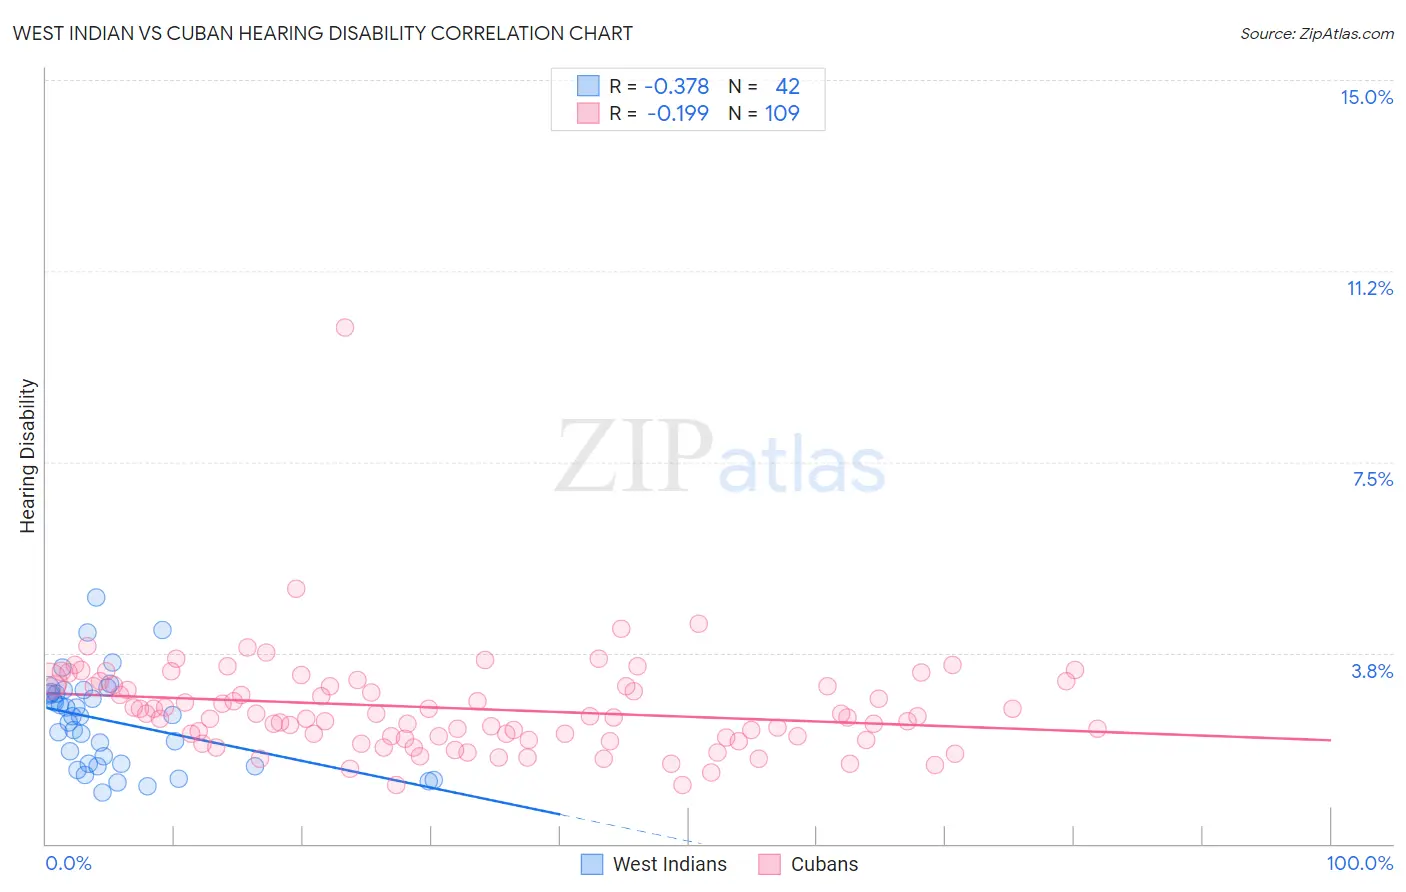
West Indian vs Cuban Hearing Disability Correlation Chart
The statistical analysis conducted on geographies consisting of 253,938,353 people shows a mild negative correlation between the proportion of West Indians and percentage of population with hearing disability in the United States with a correlation coefficient (R) of -0.378 and weighted average of 2.6%. Similarly, the statistical analysis conducted on geographies consisting of 449,105,745 people shows a poor negative correlation between the proportion of Cubans and percentage of population with hearing disability in the United States with a correlation coefficient (R) of -0.199 and weighted average of 2.8%, a difference of 8.0%.
Hearing Disability Correlation Summary
| Measurement | West Indian | Cuban |
| Minimum | 1.0% | 1.1% |
| Maximum | 4.8% | 10.1% |
| Range | 3.8% | 9.0% |
| Mean | 2.4% | 2.7% |
| Median | 2.5% | 2.5% |
| Interquartile 25% (IQ1) | 1.6% | 2.1% |
| Interquartile 75% (IQ3) | 3.0% | 3.1% |
| Interquartile Range (IQR) | 1.4% | 1.0% |
| Standard Deviation (Sample) | 0.91% | 1.0% |
| Standard Deviation (Population) | 0.90% | 1.0% |
Similar Demographics by Hearing Disability
Demographics Similar to West Indians by Hearing Disability
In terms of hearing disability, the demographic groups most similar to West Indians are Immigrants from Taiwan (2.6%, a difference of 0.010%), Senegalese (2.6%, a difference of 0.010%), Nigerian (2.6%, a difference of 0.23%), Venezuelan (2.6%, a difference of 0.25%), and Haitian (2.6%, a difference of 0.34%).
| Demographics | Rating | Rank | Hearing Disability |
| Salvadorans | 99.6 /100 | #35 | Exceptional 2.6% |
| Okinawans | 99.6 /100 | #36 | Exceptional 2.6% |
| Immigrants | Western Africa | 99.6 /100 | #37 | Exceptional 2.6% |
| Immigrants | Jamaica | 99.5 /100 | #38 | Exceptional 2.6% |
| Immigrants | China | 99.5 /100 | #39 | Exceptional 2.6% |
| Haitians | 99.5 /100 | #40 | Exceptional 2.6% |
| Immigrants | Taiwan | 99.4 /100 | #41 | Exceptional 2.6% |
| West Indians | 99.4 /100 | #42 | Exceptional 2.6% |
| Senegalese | 99.4 /100 | #43 | Exceptional 2.6% |
| Nigerians | 99.4 /100 | #44 | Exceptional 2.6% |
| Venezuelans | 99.4 /100 | #45 | Exceptional 2.6% |
| Immigrants | Dominica | 99.3 /100 | #46 | Exceptional 2.6% |
| Immigrants | Israel | 99.3 /100 | #47 | Exceptional 2.6% |
| Immigrants | Singapore | 99.3 /100 | #48 | Exceptional 2.6% |
| Immigrants | South America | 99.2 /100 | #49 | Exceptional 2.7% |
Demographics Similar to Cubans by Hearing Disability
In terms of hearing disability, the demographic groups most similar to Cubans are Jordanian (2.8%, a difference of 0.030%), Liberian (2.8%, a difference of 0.090%), Kenyan (2.8%, a difference of 0.12%), Zimbabwean (2.8%, a difference of 0.14%), and Immigrants from Liberia (2.8%, a difference of 0.16%).
| Demographics | Rating | Rank | Hearing Disability |
| Cambodians | 91.1 /100 | #114 | Exceptional 2.8% |
| Immigrants | Latin America | 90.5 /100 | #115 | Exceptional 2.8% |
| Immigrants | Immigrants | 90.3 /100 | #116 | Exceptional 2.8% |
| Immigrants | Liberia | 90.0 /100 | #117 | Excellent 2.8% |
| Zimbabweans | 89.9 /100 | #118 | Excellent 2.8% |
| Kenyans | 89.8 /100 | #119 | Excellent 2.8% |
| Jordanians | 89.5 /100 | #120 | Excellent 2.8% |
| Cubans | 89.4 /100 | #121 | Excellent 2.8% |
| Liberians | 89.0 /100 | #122 | Excellent 2.8% |
| Immigrants | Zaire | 88.6 /100 | #123 | Excellent 2.9% |
| Bahamians | 88.6 /100 | #124 | Excellent 2.9% |
| Immigrants | Albania | 88.5 /100 | #125 | Excellent 2.9% |
| Immigrants | Sudan | 87.8 /100 | #126 | Excellent 2.9% |
| South American Indians | 86.9 /100 | #127 | Excellent 2.9% |
| Immigrants | Western Asia | 86.9 /100 | #128 | Excellent 2.9% |