Iraqi vs Immigrants from Zaire Bachelor's Degree
COMPARE
Iraqi
Immigrants from Zaire
Bachelor's Degree
Bachelor's Degree Comparison
Iraqis
Immigrants from Zaire
39.0%
BACHELOR'S DEGREE
78.1/ 100
METRIC RATING
148th/ 347
METRIC RANK
36.8%
BACHELOR'S DEGREE
25.3/ 100
METRIC RATING
202nd/ 347
METRIC RANK
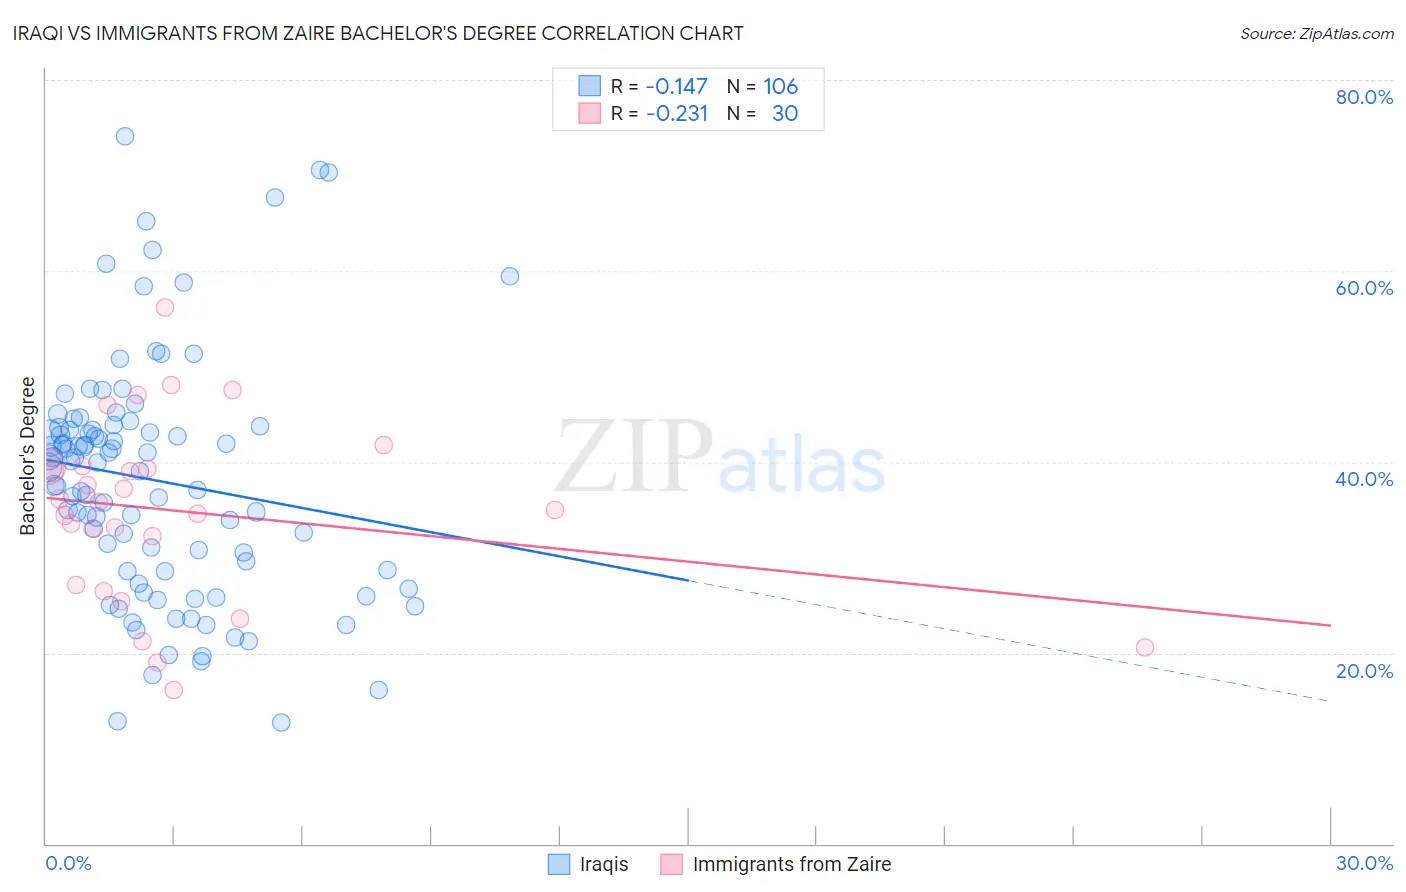
Iraqi vs Immigrants from Zaire Bachelor's Degree Correlation Chart
The statistical analysis conducted on geographies consisting of 170,654,288 people shows a poor negative correlation between the proportion of Iraqis and percentage of population with at least bachelor's degree education in the United States with a correlation coefficient (R) of -0.147 and weighted average of 39.0%. Similarly, the statistical analysis conducted on geographies consisting of 107,252,315 people shows a weak negative correlation between the proportion of Immigrants from Zaire and percentage of population with at least bachelor's degree education in the United States with a correlation coefficient (R) of -0.231 and weighted average of 36.8%, a difference of 5.9%.
Bachelor's Degree Correlation Summary
| Measurement | Iraqi | Immigrants from Zaire |
| Minimum | 12.8% | 16.2% |
| Maximum | 74.1% | 56.2% |
| Range | 61.3% | 40.0% |
| Mean | 38.1% | 34.8% |
| Median | 39.7% | 35.4% |
| Interquartile 25% (IQ1) | 28.6% | 27.1% |
| Interquartile 75% (IQ3) | 43.6% | 39.5% |
| Interquartile Range (IQR) | 15.0% | 12.4% |
| Standard Deviation (Sample) | 12.6% | 9.4% |
| Standard Deviation (Population) | 12.5% | 9.3% |
Similar Demographics by Bachelor's Degree
Demographics Similar to Iraqis by Bachelor's Degree
In terms of bachelor's degree, the demographic groups most similar to Iraqis are Immigrants from Poland (39.0%, a difference of 0.080%), South American (38.9%, a difference of 0.11%), Immigrants from Sierra Leone (39.0%, a difference of 0.14%), Swedish (39.1%, a difference of 0.17%), and Slovene (39.1%, a difference of 0.21%).
| Demographics | Rating | Rank | Bachelor's Degree |
| South American Indians | 83.6 /100 | #141 | Excellent 39.3% |
| Immigrants | North Macedonia | 81.6 /100 | #142 | Excellent 39.2% |
| Poles | 79.8 /100 | #143 | Good 39.1% |
| Immigrants | Afghanistan | 79.7 /100 | #144 | Good 39.1% |
| Slovenes | 79.5 /100 | #145 | Good 39.1% |
| Swedes | 79.2 /100 | #146 | Good 39.1% |
| Immigrants | Sierra Leone | 79.0 /100 | #147 | Good 39.0% |
| Iraqis | 78.1 /100 | #148 | Good 39.0% |
| Immigrants | Poland | 77.5 /100 | #149 | Good 39.0% |
| South Americans | 77.3 /100 | #150 | Good 38.9% |
| Immigrants | Africa | 76.5 /100 | #151 | Good 38.9% |
| Sudanese | 76.4 /100 | #152 | Good 38.9% |
| Slavs | 75.9 /100 | #153 | Good 38.9% |
| Canadians | 75.0 /100 | #154 | Good 38.8% |
| Immigrants | Kenya | 73.8 /100 | #155 | Good 38.8% |
Demographics Similar to Immigrants from Zaire by Bachelor's Degree
In terms of bachelor's degree, the demographic groups most similar to Immigrants from Zaire are Immigrants from South Eastern Asia (36.8%, a difference of 0.010%), Immigrants from Ghana (36.9%, a difference of 0.27%), Immigrants from Costa Rica (36.9%, a difference of 0.28%), Immigrants from Nigeria (36.7%, a difference of 0.29%), and Immigrants (36.7%, a difference of 0.33%).
| Demographics | Rating | Rank | Bachelor's Degree |
| Koreans | 29.8 /100 | #195 | Fair 37.0% |
| Celtics | 29.5 /100 | #196 | Fair 37.0% |
| Czechoslovakians | 29.2 /100 | #197 | Fair 37.0% |
| Welsh | 29.1 /100 | #198 | Fair 37.0% |
| Immigrants | Costa Rica | 27.4 /100 | #199 | Fair 36.9% |
| Immigrants | Ghana | 27.4 /100 | #200 | Fair 36.9% |
| Immigrants | South Eastern Asia | 25.4 /100 | #201 | Fair 36.8% |
| Immigrants | Zaire | 25.3 /100 | #202 | Fair 36.8% |
| Immigrants | Nigeria | 23.1 /100 | #203 | Fair 36.7% |
| Immigrants | Immigrants | 22.8 /100 | #204 | Fair 36.7% |
| Finns | 22.2 /100 | #205 | Fair 36.7% |
| Spaniards | 21.2 /100 | #206 | Fair 36.6% |
| Immigrants | Middle Africa | 20.6 /100 | #207 | Fair 36.6% |
| Immigrants | Thailand | 19.4 /100 | #208 | Poor 36.5% |
| Panamanians | 18.8 /100 | #209 | Poor 36.5% |