Pakistani vs Immigrants from Zaire Bachelor's Degree
COMPARE
Pakistani
Immigrants from Zaire
Bachelor's Degree
Bachelor's Degree Comparison
Pakistanis
Immigrants from Zaire
39.7%
BACHELOR'S DEGREE
88.2/ 100
METRIC RATING
136th/ 347
METRIC RANK
36.8%
BACHELOR'S DEGREE
25.3/ 100
METRIC RATING
202nd/ 347
METRIC RANK
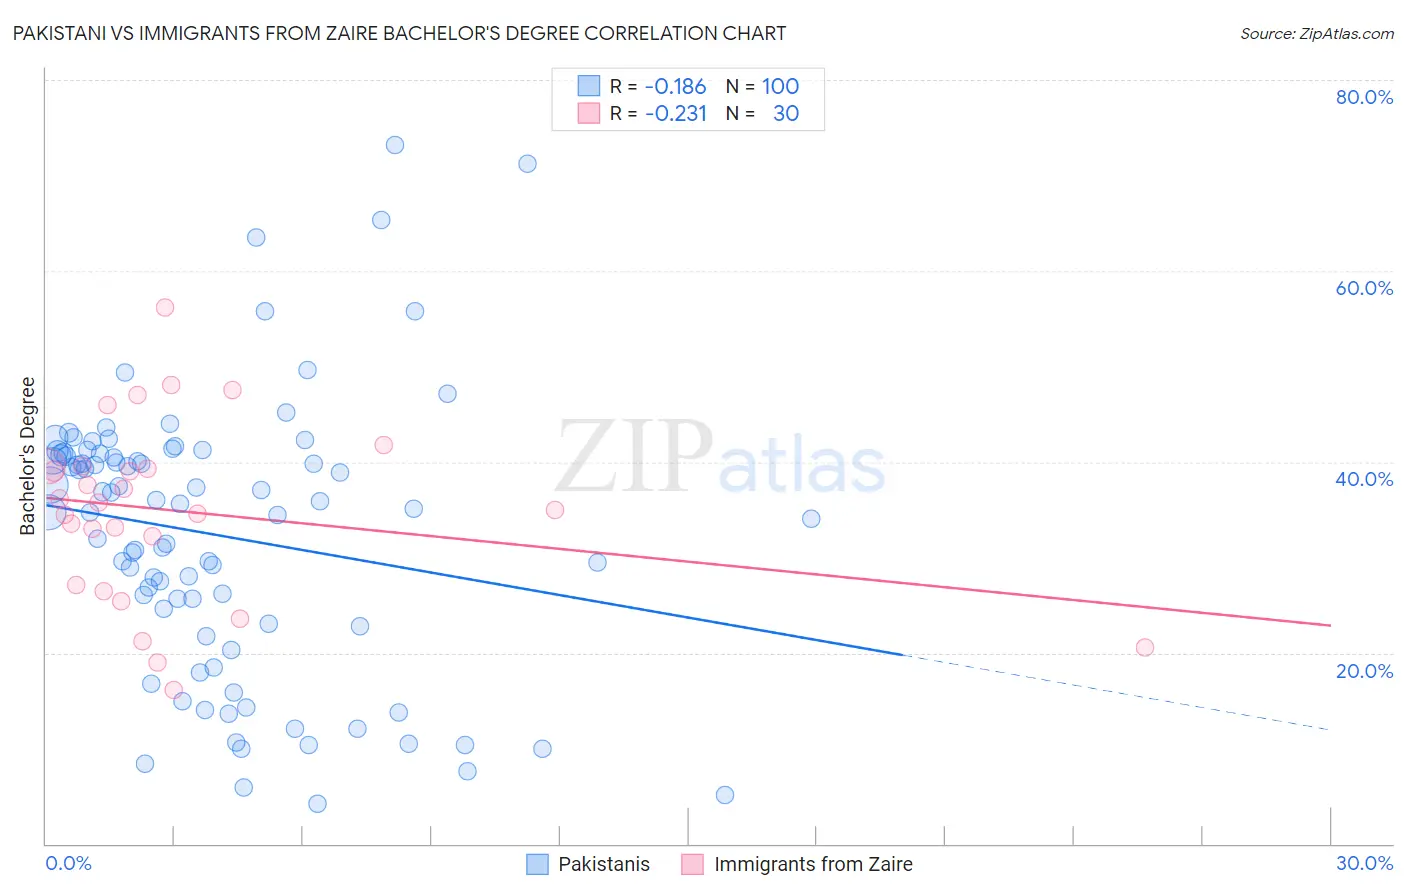
Pakistani vs Immigrants from Zaire Bachelor's Degree Correlation Chart
The statistical analysis conducted on geographies consisting of 335,326,459 people shows a poor negative correlation between the proportion of Pakistanis and percentage of population with at least bachelor's degree education in the United States with a correlation coefficient (R) of -0.186 and weighted average of 39.7%. Similarly, the statistical analysis conducted on geographies consisting of 107,252,315 people shows a weak negative correlation between the proportion of Immigrants from Zaire and percentage of population with at least bachelor's degree education in the United States with a correlation coefficient (R) of -0.231 and weighted average of 36.8%, a difference of 7.7%.
Bachelor's Degree Correlation Summary
| Measurement | Pakistani | Immigrants from Zaire |
| Minimum | 4.2% | 16.2% |
| Maximum | 73.2% | 56.2% |
| Range | 69.0% | 40.0% |
| Mean | 32.3% | 34.8% |
| Median | 35.3% | 35.4% |
| Interquartile 25% (IQ1) | 22.9% | 27.1% |
| Interquartile 75% (IQ3) | 40.7% | 39.5% |
| Interquartile Range (IQR) | 17.9% | 12.4% |
| Standard Deviation (Sample) | 14.3% | 9.4% |
| Standard Deviation (Population) | 14.3% | 9.3% |
Similar Demographics by Bachelor's Degree
Demographics Similar to Pakistanis by Bachelor's Degree
In terms of bachelor's degree, the demographic groups most similar to Pakistanis are Luxembourger (39.8%, a difference of 0.20%), Assyrian/Chaldean/Syriac (39.8%, a difference of 0.28%), Icelander (39.5%, a difference of 0.37%), European (39.5%, a difference of 0.54%), and Immigrants from Southern Europe (40.0%, a difference of 0.71%).
| Demographics | Rating | Rank | Bachelor's Degree |
| Serbians | 92.4 /100 | #129 | Exceptional 40.1% |
| Sierra Leoneans | 92.2 /100 | #130 | Exceptional 40.1% |
| Italians | 91.9 /100 | #131 | Exceptional 40.1% |
| Taiwanese | 91.1 /100 | #132 | Exceptional 40.0% |
| Immigrants | Southern Europe | 91.1 /100 | #133 | Exceptional 40.0% |
| Assyrians/Chaldeans/Syriacs | 89.4 /100 | #134 | Excellent 39.8% |
| Luxembourgers | 89.1 /100 | #135 | Excellent 39.8% |
| Pakistanis | 88.2 /100 | #136 | Excellent 39.7% |
| Icelanders | 86.5 /100 | #137 | Excellent 39.5% |
| Europeans | 85.6 /100 | #138 | Excellent 39.5% |
| Immigrants | Sudan | 84.5 /100 | #139 | Excellent 39.4% |
| Immigrants | Armenia | 84.1 /100 | #140 | Excellent 39.4% |
| South American Indians | 83.6 /100 | #141 | Excellent 39.3% |
| Immigrants | North Macedonia | 81.6 /100 | #142 | Excellent 39.2% |
| Poles | 79.8 /100 | #143 | Good 39.1% |
Demographics Similar to Immigrants from Zaire by Bachelor's Degree
In terms of bachelor's degree, the demographic groups most similar to Immigrants from Zaire are Immigrants from South Eastern Asia (36.8%, a difference of 0.010%), Immigrants from Ghana (36.9%, a difference of 0.27%), Immigrants from Costa Rica (36.9%, a difference of 0.28%), Immigrants from Nigeria (36.7%, a difference of 0.29%), and Immigrants (36.7%, a difference of 0.33%).
| Demographics | Rating | Rank | Bachelor's Degree |
| Koreans | 29.8 /100 | #195 | Fair 37.0% |
| Celtics | 29.5 /100 | #196 | Fair 37.0% |
| Czechoslovakians | 29.2 /100 | #197 | Fair 37.0% |
| Welsh | 29.1 /100 | #198 | Fair 37.0% |
| Immigrants | Costa Rica | 27.4 /100 | #199 | Fair 36.9% |
| Immigrants | Ghana | 27.4 /100 | #200 | Fair 36.9% |
| Immigrants | South Eastern Asia | 25.4 /100 | #201 | Fair 36.8% |
| Immigrants | Zaire | 25.3 /100 | #202 | Fair 36.8% |
| Immigrants | Nigeria | 23.1 /100 | #203 | Fair 36.7% |
| Immigrants | Immigrants | 22.8 /100 | #204 | Fair 36.7% |
| Finns | 22.2 /100 | #205 | Fair 36.7% |
| Spaniards | 21.2 /100 | #206 | Fair 36.6% |
| Immigrants | Middle Africa | 20.6 /100 | #207 | Fair 36.6% |
| Immigrants | Thailand | 19.4 /100 | #208 | Poor 36.5% |
| Panamanians | 18.8 /100 | #209 | Poor 36.5% |