British vs Immigrants from Fiji 5th Grade
COMPARE
British
Immigrants from Fiji
5th Grade
5th Grade Comparison
British
Immigrants from Fiji
98.1%
5TH GRADE
100.0/ 100
METRIC RATING
36th/ 347
METRIC RANK
95.6%
5TH GRADE
0.0/ 100
METRIC RATING
323rd/ 347
METRIC RANK
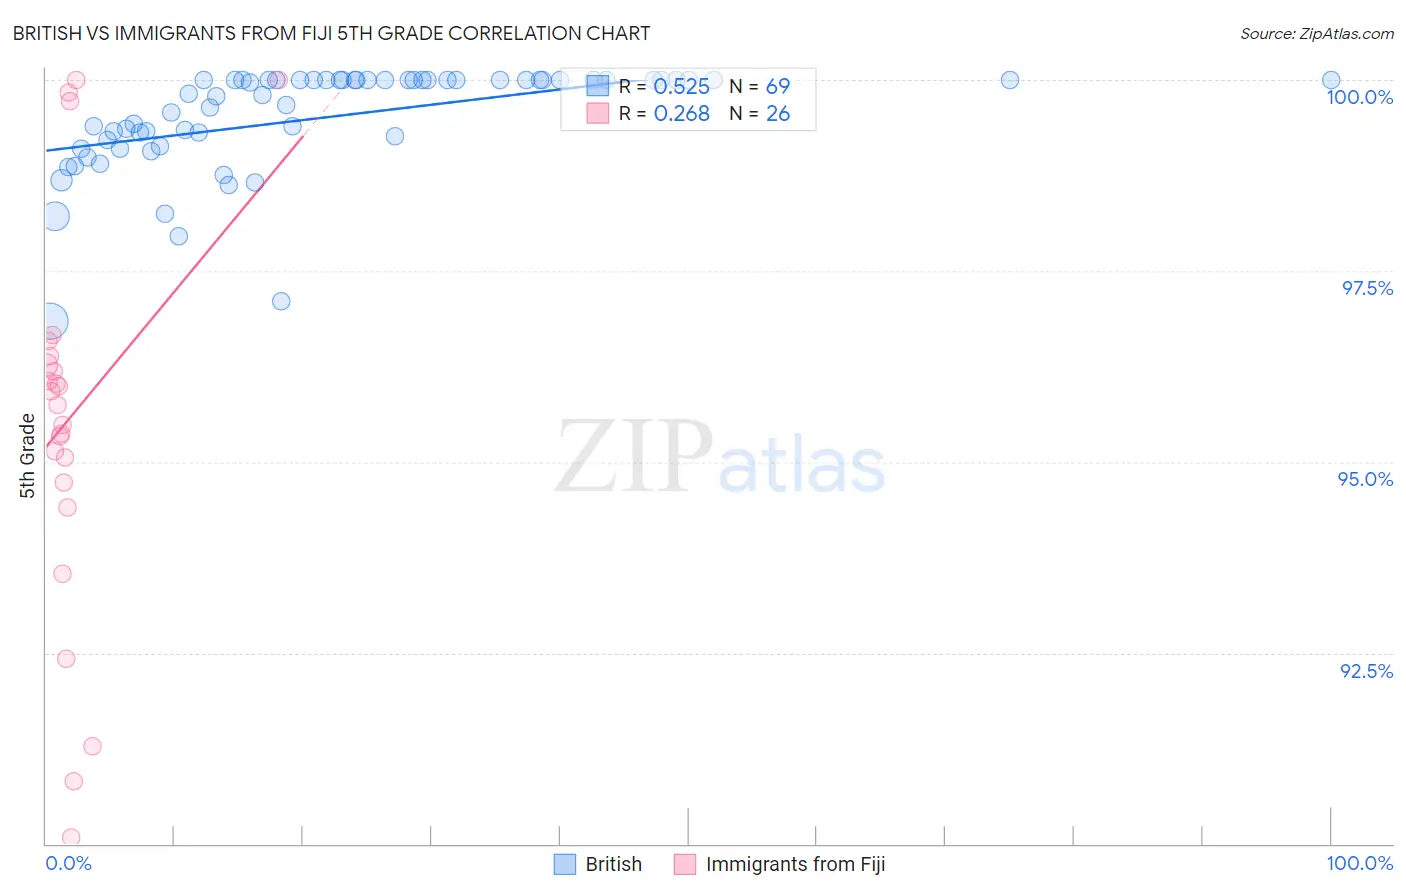
British vs Immigrants from Fiji 5th Grade Correlation Chart
The statistical analysis conducted on geographies consisting of 531,462,526 people shows a substantial positive correlation between the proportion of British and percentage of population with at least 5th grade education in the United States with a correlation coefficient (R) of 0.525 and weighted average of 98.1%. Similarly, the statistical analysis conducted on geographies consisting of 93,756,204 people shows a weak positive correlation between the proportion of Immigrants from Fiji and percentage of population with at least 5th grade education in the United States with a correlation coefficient (R) of 0.268 and weighted average of 95.6%, a difference of 2.6%.
5th Grade Correlation Summary
| Measurement | British | Immigrants from Fiji |
| Minimum | 96.8% | 90.1% |
| Maximum | 100.0% | 100.0% |
| Range | 3.2% | 9.9% |
| Mean | 99.5% | 95.6% |
| Median | 100.0% | 95.8% |
| Interquartile 25% (IQ1) | 99.2% | 94.7% |
| Interquartile 75% (IQ3) | 100.0% | 96.4% |
| Interquartile Range (IQR) | 0.83% | 1.6% |
| Standard Deviation (Sample) | 0.69% | 2.6% |
| Standard Deviation (Population) | 0.69% | 2.5% |
Similar Demographics by 5th Grade
Demographics Similar to British by 5th Grade
In terms of 5th grade, the demographic groups most similar to British are Italian (98.1%, a difference of 0.010%), Swiss (98.1%, a difference of 0.020%), Chinese (98.1%, a difference of 0.020%), Latvian (98.1%, a difference of 0.020%), and Chippewa (98.1%, a difference of 0.030%).
| Demographics | Rating | Rank | 5th Grade |
| Scandinavians | 100.0 /100 | #29 | Exceptional 98.2% |
| French Canadians | 100.0 /100 | #30 | Exceptional 98.2% |
| Europeans | 100.0 /100 | #31 | Exceptional 98.2% |
| Chippewa | 100.0 /100 | #32 | Exceptional 98.1% |
| Swiss | 100.0 /100 | #33 | Exceptional 98.1% |
| Chinese | 100.0 /100 | #34 | Exceptional 98.1% |
| Italians | 100.0 /100 | #35 | Exceptional 98.1% |
| British | 100.0 /100 | #36 | Exceptional 98.1% |
| Latvians | 99.9 /100 | #37 | Exceptional 98.1% |
| Belgians | 99.9 /100 | #38 | Exceptional 98.1% |
| Luxembourgers | 99.9 /100 | #39 | Exceptional 98.1% |
| Eastern Europeans | 99.9 /100 | #40 | Exceptional 98.1% |
| Hungarians | 99.9 /100 | #41 | Exceptional 98.0% |
| Northern Europeans | 99.9 /100 | #42 | Exceptional 98.0% |
| Ottawa | 99.9 /100 | #43 | Exceptional 98.0% |
Demographics Similar to Immigrants from Fiji by 5th Grade
In terms of 5th grade, the demographic groups most similar to Immigrants from Fiji are Honduran (95.6%, a difference of 0.020%), Hispanic or Latino (95.6%, a difference of 0.020%), Immigrants from Nicaragua (95.6%, a difference of 0.050%), Immigrants from Cambodia (95.5%, a difference of 0.050%), and Dominican (95.5%, a difference of 0.050%).
| Demographics | Rating | Rank | 5th Grade |
| Immigrants | Ecuador | 0.0 /100 | #316 | Tragic 95.8% |
| Belizeans | 0.0 /100 | #317 | Tragic 95.8% |
| Immigrants | Vietnam | 0.0 /100 | #318 | Tragic 95.8% |
| Japanese | 0.0 /100 | #319 | Tragic 95.7% |
| Central American Indians | 0.0 /100 | #320 | Tragic 95.7% |
| Immigrants | Belize | 0.0 /100 | #321 | Tragic 95.7% |
| Immigrants | Nicaragua | 0.0 /100 | #322 | Tragic 95.6% |
| Immigrants | Fiji | 0.0 /100 | #323 | Tragic 95.6% |
| Hondurans | 0.0 /100 | #324 | Tragic 95.6% |
| Hispanics or Latinos | 0.0 /100 | #325 | Tragic 95.6% |
| Immigrants | Cambodia | 0.0 /100 | #326 | Tragic 95.5% |
| Dominicans | 0.0 /100 | #327 | Tragic 95.5% |
| Cape Verdeans | 0.0 /100 | #328 | Tragic 95.5% |
| Mexican American Indians | 0.0 /100 | #329 | Tragic 95.5% |
| Immigrants | Armenia | 0.0 /100 | #330 | Tragic 95.4% |