Argentinean vs Immigrants from Fiji 5th Grade
COMPARE
Argentinean
Immigrants from Fiji
5th Grade
5th Grade Comparison
Argentineans
Immigrants from Fiji
97.3%
5TH GRADE
39.5/ 100
METRIC RATING
181st/ 347
METRIC RANK
95.6%
5TH GRADE
0.0/ 100
METRIC RATING
323rd/ 347
METRIC RANK
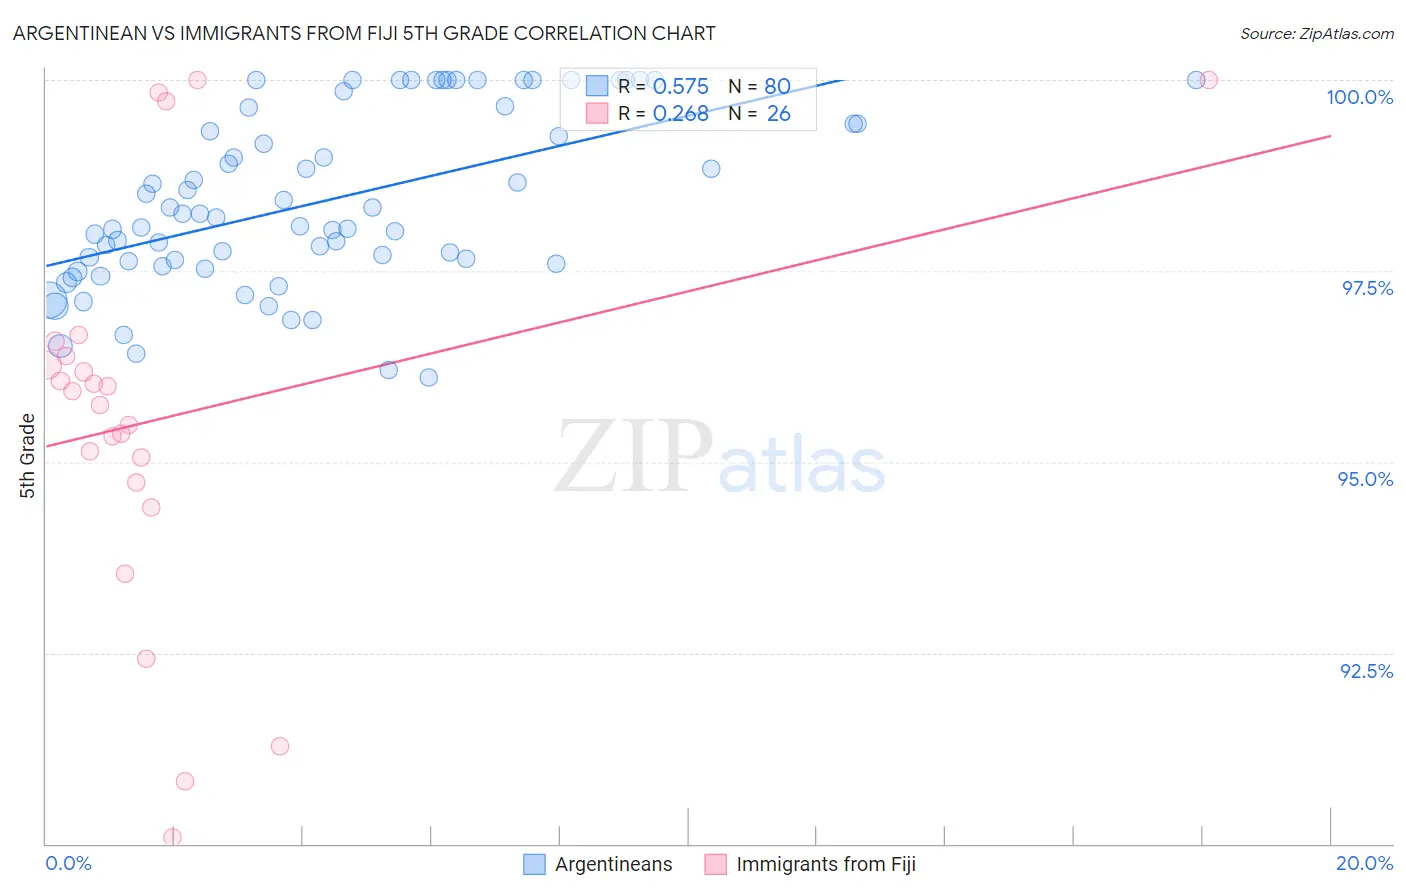
Argentinean vs Immigrants from Fiji 5th Grade Correlation Chart
The statistical analysis conducted on geographies consisting of 297,141,305 people shows a substantial positive correlation between the proportion of Argentineans and percentage of population with at least 5th grade education in the United States with a correlation coefficient (R) of 0.575 and weighted average of 97.3%. Similarly, the statistical analysis conducted on geographies consisting of 93,756,204 people shows a weak positive correlation between the proportion of Immigrants from Fiji and percentage of population with at least 5th grade education in the United States with a correlation coefficient (R) of 0.268 and weighted average of 95.6%, a difference of 1.8%.
5th Grade Correlation Summary
| Measurement | Argentinean | Immigrants from Fiji |
| Minimum | 96.1% | 90.1% |
| Maximum | 100.0% | 100.0% |
| Range | 3.9% | 9.9% |
| Mean | 98.4% | 95.6% |
| Median | 98.2% | 95.8% |
| Interquartile 25% (IQ1) | 97.6% | 94.7% |
| Interquartile 75% (IQ3) | 99.5% | 96.4% |
| Interquartile Range (IQR) | 1.9% | 1.6% |
| Standard Deviation (Sample) | 1.1% | 2.6% |
| Standard Deviation (Population) | 1.1% | 2.5% |
Similar Demographics by 5th Grade
Demographics Similar to Argentineans by 5th Grade
In terms of 5th grade, the demographic groups most similar to Argentineans are Immigrants from Kenya (97.3%, a difference of 0.0%), Pakistani (97.3%, a difference of 0.0%), Mongolian (97.3%, a difference of 0.0%), Immigrants from Ukraine (97.3%, a difference of 0.0%), and Comanche (97.3%, a difference of 0.010%).
| Demographics | Rating | Rank | 5th Grade |
| Immigrants | Kazakhstan | 50.0 /100 | #174 | Average 97.3% |
| Immigrants | Micronesia | 48.8 /100 | #175 | Average 97.3% |
| Immigrants | Taiwan | 48.4 /100 | #176 | Average 97.3% |
| Immigrants | Spain | 47.0 /100 | #177 | Average 97.3% |
| Comanche | 42.1 /100 | #178 | Average 97.3% |
| Immigrants | Kenya | 40.3 /100 | #179 | Average 97.3% |
| Pakistanis | 40.2 /100 | #180 | Average 97.3% |
| Argentineans | 39.5 /100 | #181 | Fair 97.3% |
| Mongolians | 39.4 /100 | #182 | Fair 97.3% |
| Immigrants | Ukraine | 38.6 /100 | #183 | Fair 97.3% |
| Immigrants | Venezuela | 38.4 /100 | #184 | Fair 97.3% |
| Dutch West Indians | 36.2 /100 | #185 | Fair 97.3% |
| Immigrants | Argentina | 36.1 /100 | #186 | Fair 97.3% |
| Spanish Americans | 34.7 /100 | #187 | Fair 97.3% |
| Paraguayans | 33.7 /100 | #188 | Fair 97.3% |
Demographics Similar to Immigrants from Fiji by 5th Grade
In terms of 5th grade, the demographic groups most similar to Immigrants from Fiji are Honduran (95.6%, a difference of 0.020%), Hispanic or Latino (95.6%, a difference of 0.020%), Immigrants from Nicaragua (95.6%, a difference of 0.050%), Immigrants from Cambodia (95.5%, a difference of 0.050%), and Dominican (95.5%, a difference of 0.050%).
| Demographics | Rating | Rank | 5th Grade |
| Immigrants | Ecuador | 0.0 /100 | #316 | Tragic 95.8% |
| Belizeans | 0.0 /100 | #317 | Tragic 95.8% |
| Immigrants | Vietnam | 0.0 /100 | #318 | Tragic 95.8% |
| Japanese | 0.0 /100 | #319 | Tragic 95.7% |
| Central American Indians | 0.0 /100 | #320 | Tragic 95.7% |
| Immigrants | Belize | 0.0 /100 | #321 | Tragic 95.7% |
| Immigrants | Nicaragua | 0.0 /100 | #322 | Tragic 95.6% |
| Immigrants | Fiji | 0.0 /100 | #323 | Tragic 95.6% |
| Hondurans | 0.0 /100 | #324 | Tragic 95.6% |
| Hispanics or Latinos | 0.0 /100 | #325 | Tragic 95.6% |
| Immigrants | Cambodia | 0.0 /100 | #326 | Tragic 95.5% |
| Dominicans | 0.0 /100 | #327 | Tragic 95.5% |
| Cape Verdeans | 0.0 /100 | #328 | Tragic 95.5% |
| Mexican American Indians | 0.0 /100 | #329 | Tragic 95.5% |
| Immigrants | Armenia | 0.0 /100 | #330 | Tragic 95.4% |