Immigrants from Caribbean vs Immigrants from Fiji 5th Grade
COMPARE
Immigrants from Caribbean
Immigrants from Fiji
5th Grade
5th Grade Comparison
Immigrants from Caribbean
Immigrants from Fiji
96.0%
5TH GRADE
0.0/ 100
METRIC RATING
307th/ 347
METRIC RANK
95.6%
5TH GRADE
0.0/ 100
METRIC RATING
323rd/ 347
METRIC RANK
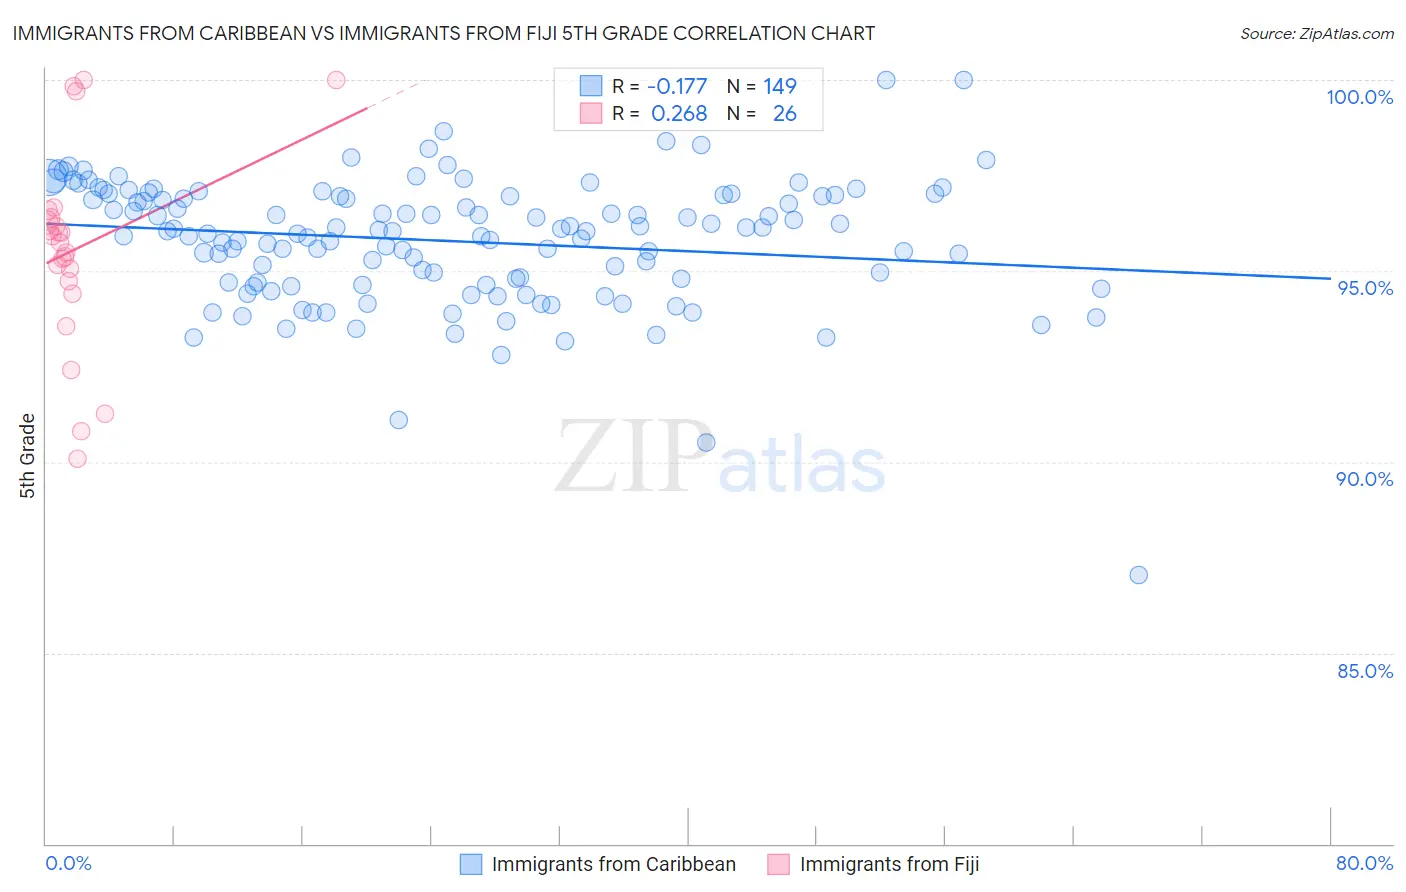
Immigrants from Caribbean vs Immigrants from Fiji 5th Grade Correlation Chart
The statistical analysis conducted on geographies consisting of 450,065,262 people shows a poor negative correlation between the proportion of Immigrants from Caribbean and percentage of population with at least 5th grade education in the United States with a correlation coefficient (R) of -0.177 and weighted average of 96.0%. Similarly, the statistical analysis conducted on geographies consisting of 93,756,204 people shows a weak positive correlation between the proportion of Immigrants from Fiji and percentage of population with at least 5th grade education in the United States with a correlation coefficient (R) of 0.268 and weighted average of 95.6%, a difference of 0.46%.
5th Grade Correlation Summary
| Measurement | Immigrants from Caribbean | Immigrants from Fiji |
| Minimum | 87.0% | 90.1% |
| Maximum | 100.0% | 100.0% |
| Range | 13.0% | 9.9% |
| Mean | 95.8% | 95.6% |
| Median | 96.0% | 95.8% |
| Interquartile 25% (IQ1) | 94.7% | 94.7% |
| Interquartile 75% (IQ3) | 97.0% | 96.4% |
| Interquartile Range (IQR) | 2.3% | 1.6% |
| Standard Deviation (Sample) | 1.7% | 2.6% |
| Standard Deviation (Population) | 1.7% | 2.5% |
Demographics Similar to Immigrants from Caribbean and Immigrants from Fiji by 5th Grade
In terms of 5th grade, the demographic groups most similar to Immigrants from Caribbean are Immigrants from Haiti (96.0%, a difference of 0.0%), Ecuadorian (96.0%, a difference of 0.010%), Immigrants from Laos (96.0%, a difference of 0.020%), Immigrants from Guyana (96.0%, a difference of 0.020%), and Indonesian (96.0%, a difference of 0.060%). Similarly, the demographic groups most similar to Immigrants from Fiji are Honduran (95.6%, a difference of 0.020%), Hispanic or Latino (95.6%, a difference of 0.020%), Immigrants from Nicaragua (95.6%, a difference of 0.050%), Immigrants from Belize (95.7%, a difference of 0.070%), and Central American Indian (95.7%, a difference of 0.14%).
| Demographics | Rating | Rank | 5th Grade |
| Immigrants | Laos | 0.0 /100 | #305 | Tragic 96.0% |
| Immigrants | Haiti | 0.0 /100 | #306 | Tragic 96.0% |
| Immigrants | Caribbean | 0.0 /100 | #307 | Tragic 96.0% |
| Ecuadorians | 0.0 /100 | #308 | Tragic 96.0% |
| Immigrants | Guyana | 0.0 /100 | #309 | Tragic 96.0% |
| Indonesians | 0.0 /100 | #310 | Tragic 96.0% |
| Immigrants | Bangladesh | 0.0 /100 | #311 | Tragic 96.0% |
| Vietnamese | 0.0 /100 | #312 | Tragic 95.9% |
| Bangladeshis | 0.0 /100 | #313 | Tragic 95.9% |
| Immigrants | Portugal | 0.0 /100 | #314 | Tragic 95.9% |
| Nicaraguans | 0.0 /100 | #315 | Tragic 95.9% |
| Immigrants | Ecuador | 0.0 /100 | #316 | Tragic 95.8% |
| Belizeans | 0.0 /100 | #317 | Tragic 95.8% |
| Immigrants | Vietnam | 0.0 /100 | #318 | Tragic 95.8% |
| Japanese | 0.0 /100 | #319 | Tragic 95.7% |
| Central American Indians | 0.0 /100 | #320 | Tragic 95.7% |
| Immigrants | Belize | 0.0 /100 | #321 | Tragic 95.7% |
| Immigrants | Nicaragua | 0.0 /100 | #322 | Tragic 95.6% |
| Immigrants | Fiji | 0.0 /100 | #323 | Tragic 95.6% |
| Hondurans | 0.0 /100 | #324 | Tragic 95.6% |
| Hispanics or Latinos | 0.0 /100 | #325 | Tragic 95.6% |