Welsh vs Immigrants from Israel 5th Grade
COMPARE
Welsh
Immigrants from Israel
5th Grade
5th Grade Comparison
Welsh
Immigrants from Israel
98.6%
5TH GRADE
100.0/ 100
METRIC RATING
2nd/ 347
METRIC RANK
97.5%
5TH GRADE
79.1/ 100
METRIC RATING
148th/ 347
METRIC RANK
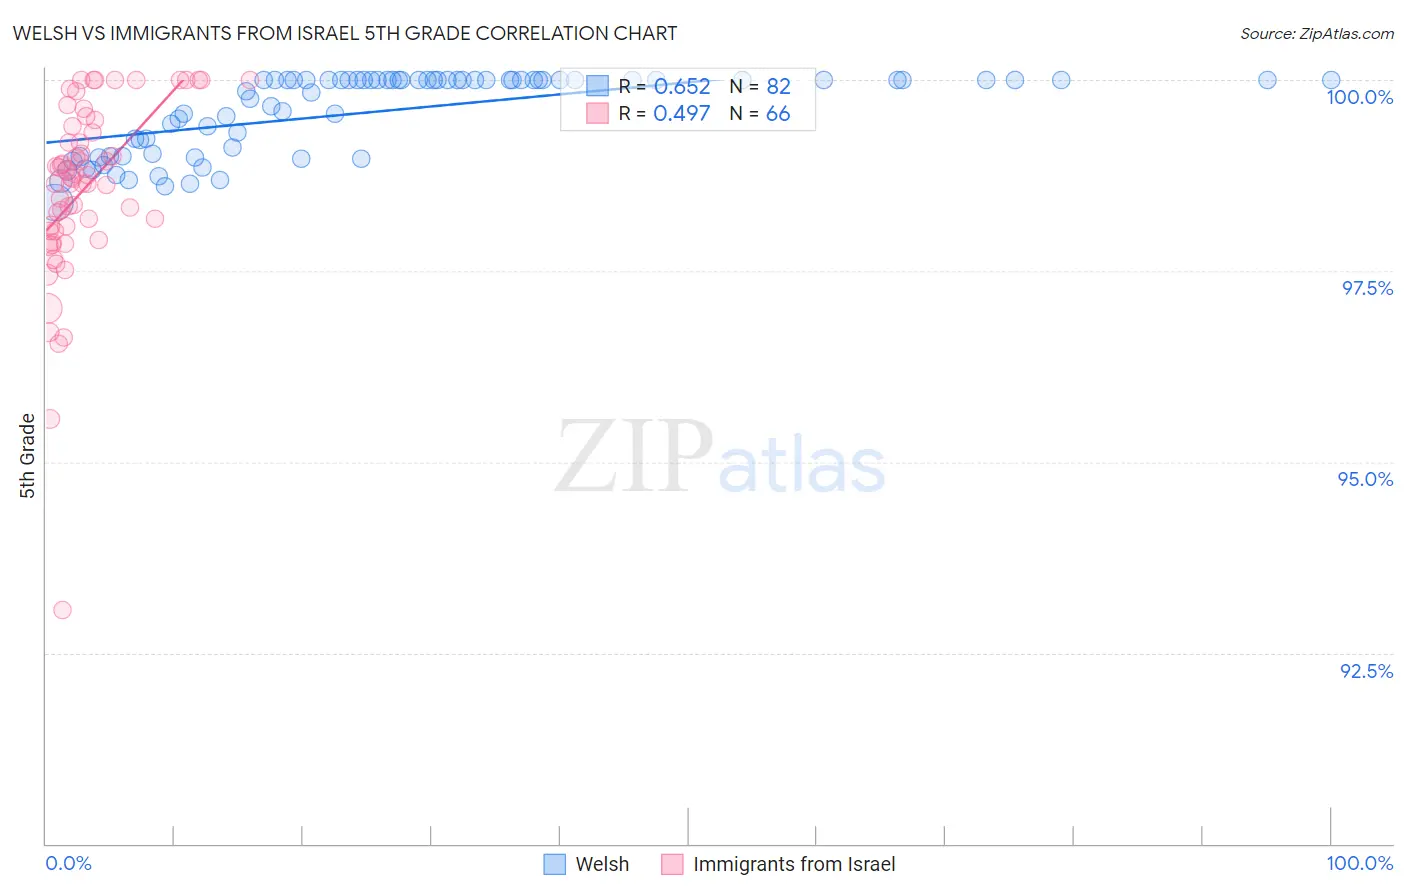
Welsh vs Immigrants from Israel 5th Grade Correlation Chart
The statistical analysis conducted on geographies consisting of 239,959,962 people shows a significant positive correlation between the proportion of Welsh and percentage of population with at least 5th grade education in the United States with a correlation coefficient (R) of 0.652 and weighted average of 98.6%. Similarly, the statistical analysis conducted on geographies consisting of 210,029,773 people shows a moderate positive correlation between the proportion of Immigrants from Israel and percentage of population with at least 5th grade education in the United States with a correlation coefficient (R) of 0.497 and weighted average of 97.5%, a difference of 1.2%.
5th Grade Correlation Summary
| Measurement | Welsh | Immigrants from Israel |
| Minimum | 98.4% | 93.1% |
| Maximum | 100.0% | 100.0% |
| Range | 1.6% | 6.9% |
| Mean | 99.6% | 98.6% |
| Median | 100.0% | 98.7% |
| Interquartile 25% (IQ1) | 99.0% | 98.0% |
| Interquartile 75% (IQ3) | 100.0% | 99.4% |
| Interquartile Range (IQR) | 0.99% | 1.4% |
| Standard Deviation (Sample) | 0.52% | 1.2% |
| Standard Deviation (Population) | 0.51% | 1.2% |
Similar Demographics by 5th Grade
Demographics Similar to Welsh by 5th Grade
In terms of 5th grade, the demographic groups most similar to Welsh are Norwegian (98.4%, a difference of 0.20%), Tsimshian (98.4%, a difference of 0.20%), Slovak (98.4%, a difference of 0.22%), German (98.4%, a difference of 0.22%), and Inupiat (98.4%, a difference of 0.25%).
| Demographics | Rating | Rank | 5th Grade |
| Crow | 100.0 /100 | #1 | Exceptional 99.5% |
| Welsh | 100.0 /100 | #2 | Exceptional 98.6% |
| Norwegians | 100.0 /100 | #3 | Exceptional 98.4% |
| Tsimshian | 100.0 /100 | #4 | Exceptional 98.4% |
| Slovaks | 100.0 /100 | #5 | Exceptional 98.4% |
| Germans | 100.0 /100 | #6 | Exceptional 98.4% |
| Inupiat | 100.0 /100 | #7 | Exceptional 98.4% |
| Slovenes | 100.0 /100 | #8 | Exceptional 98.3% |
| Swedes | 100.0 /100 | #9 | Exceptional 98.3% |
| English | 100.0 /100 | #10 | Exceptional 98.3% |
| Alaskan Athabascans | 100.0 /100 | #11 | Exceptional 98.3% |
| Carpatho Rusyns | 100.0 /100 | #12 | Exceptional 98.3% |
| Tlingit-Haida | 100.0 /100 | #13 | Exceptional 98.3% |
| Dutch | 100.0 /100 | #14 | Exceptional 98.3% |
| Scottish | 100.0 /100 | #15 | Exceptional 98.3% |
Demographics Similar to Immigrants from Israel by 5th Grade
In terms of 5th grade, the demographic groups most similar to Immigrants from Israel are Hopi (97.5%, a difference of 0.0%), Immigrants from South Central Asia (97.5%, a difference of 0.0%), Soviet Union (97.5%, a difference of 0.010%), Jordanian (97.5%, a difference of 0.020%), and Spaniard (97.5%, a difference of 0.020%).
| Demographics | Rating | Rank | 5th Grade |
| Seminole | 85.8 /100 | #141 | Excellent 97.5% |
| Israelis | 85.5 /100 | #142 | Excellent 97.5% |
| Immigrants | North Macedonia | 85.4 /100 | #143 | Excellent 97.5% |
| Immigrants | Greece | 83.2 /100 | #144 | Excellent 97.5% |
| Jordanians | 82.6 /100 | #145 | Excellent 97.5% |
| Spaniards | 81.9 /100 | #146 | Excellent 97.5% |
| Soviet Union | 81.2 /100 | #147 | Excellent 97.5% |
| Immigrants | Israel | 79.1 /100 | #148 | Good 97.5% |
| Hopi | 78.6 /100 | #149 | Good 97.5% |
| Immigrants | South Central Asia | 78.6 /100 | #150 | Good 97.5% |
| Immigrants | Eastern Europe | 75.0 /100 | #151 | Good 97.4% |
| Ute | 74.9 /100 | #152 | Good 97.4% |
| Alsatians | 74.3 /100 | #153 | Good 97.4% |
| Immigrants | Russia | 71.2 /100 | #154 | Good 97.4% |
| Immigrants | Bosnia and Herzegovina | 71.0 /100 | #155 | Good 97.4% |