Barbadian vs Colombian College, 1 year or more
COMPARE
Barbadian
Colombian
College, 1 year or more
College, 1 year or more Comparison
Barbadians
Colombians
56.0%
COLLEGE, 1 YEAR OR MORE
1.3/ 100
METRIC RATING
238th/ 347
METRIC RANK
58.7%
COLLEGE, 1 YEAR OR MORE
27.6/ 100
METRIC RATING
192nd/ 347
METRIC RANK
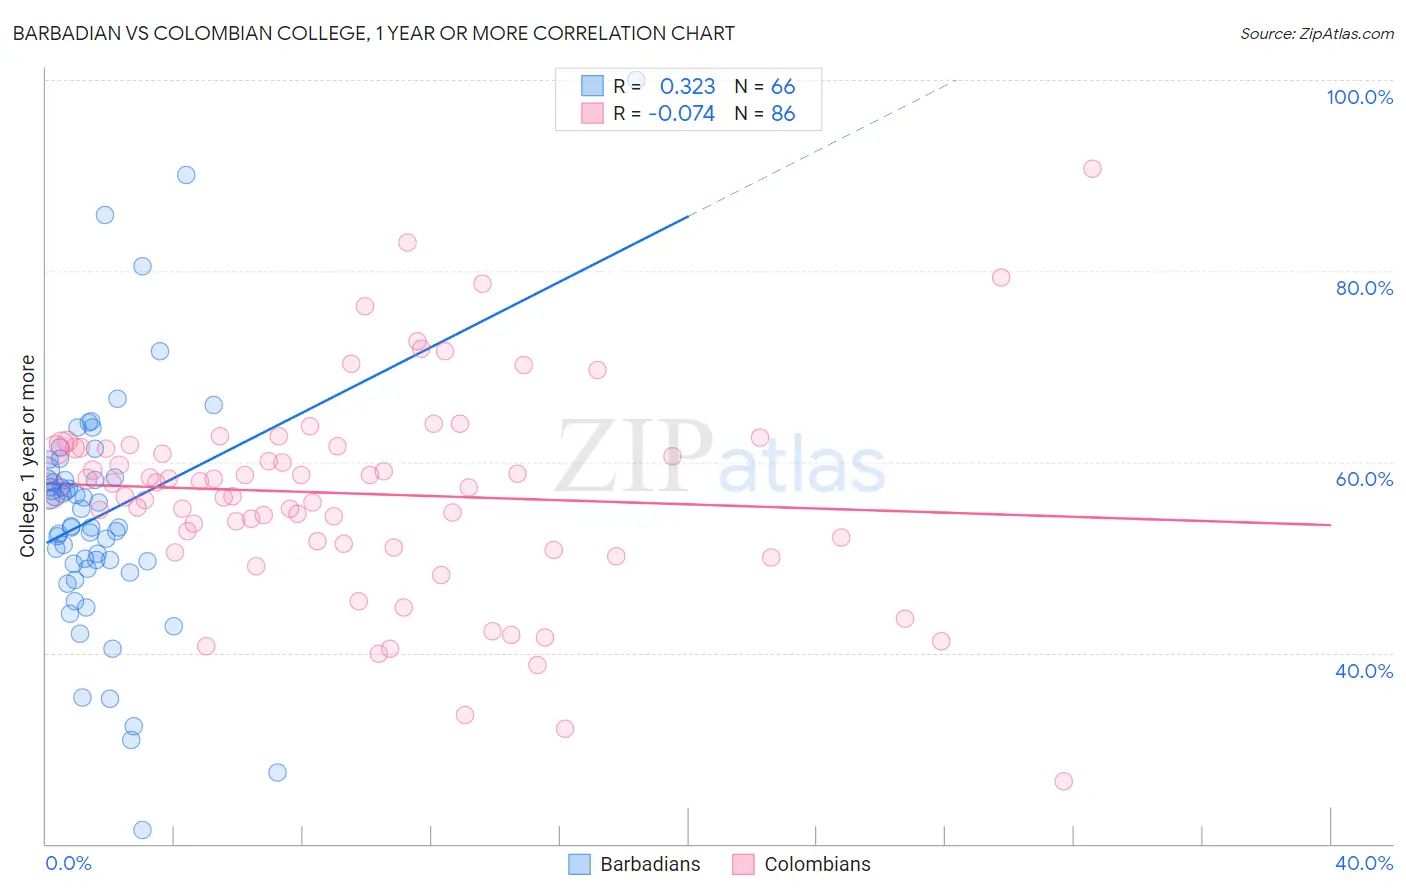
Barbadian vs Colombian College, 1 year or more Correlation Chart
The statistical analysis conducted on geographies consisting of 141,304,122 people shows a mild positive correlation between the proportion of Barbadians and percentage of population with at least college, 1 year or more education in the United States with a correlation coefficient (R) of 0.323 and weighted average of 56.0%. Similarly, the statistical analysis conducted on geographies consisting of 419,698,522 people shows a slight negative correlation between the proportion of Colombians and percentage of population with at least college, 1 year or more education in the United States with a correlation coefficient (R) of -0.074 and weighted average of 58.7%, a difference of 4.7%.
College, 1 year or more Correlation Summary
| Measurement | Barbadian | Colombian |
| Minimum | 21.4% | 26.5% |
| Maximum | 100.0% | 90.7% |
| Range | 78.6% | 64.2% |
| Mean | 54.5% | 56.7% |
| Median | 54.2% | 57.6% |
| Interquartile 25% (IQ1) | 49.4% | 51.5% |
| Interquartile 75% (IQ3) | 58.3% | 61.5% |
| Interquartile Range (IQR) | 8.9% | 10.0% |
| Standard Deviation (Sample) | 13.0% | 10.9% |
| Standard Deviation (Population) | 12.9% | 10.8% |
Similar Demographics by College, 1 year or more
Demographics Similar to Barbadians by College, 1 year or more
In terms of college, 1 year or more, the demographic groups most similar to Barbadians are Puget Sound Salish (55.9%, a difference of 0.20%), Samoan (56.2%, a difference of 0.27%), Trinidadian and Tobagonian (55.8%, a difference of 0.30%), French American Indian (55.8%, a difference of 0.34%), and Iroquois (56.2%, a difference of 0.38%).
| Demographics | Rating | Rank | College, 1 year or more |
| Immigrants | Burma/Myanmar | 2.7 /100 | #231 | Tragic 56.6% |
| Immigrants | Bangladesh | 2.6 /100 | #232 | Tragic 56.6% |
| Immigrants | Nonimmigrants | 2.5 /100 | #233 | Tragic 56.5% |
| Spanish Americans | 1.8 /100 | #234 | Tragic 56.3% |
| West Indians | 1.8 /100 | #235 | Tragic 56.3% |
| Iroquois | 1.7 /100 | #236 | Tragic 56.2% |
| Samoans | 1.6 /100 | #237 | Tragic 56.2% |
| Barbadians | 1.3 /100 | #238 | Tragic 56.0% |
| Puget Sound Salish | 1.1 /100 | #239 | Tragic 55.9% |
| Trinidadians and Tobagonians | 1.1 /100 | #240 | Tragic 55.8% |
| French American Indians | 1.0 /100 | #241 | Tragic 55.8% |
| Marshallese | 1.0 /100 | #242 | Tragic 55.8% |
| Osage | 1.0 /100 | #243 | Tragic 55.8% |
| Chippewa | 0.9 /100 | #244 | Tragic 55.7% |
| Immigrants | Liberia | 0.8 /100 | #245 | Tragic 55.7% |
Demographics Similar to Colombians by College, 1 year or more
In terms of college, 1 year or more, the demographic groups most similar to Colombians are Peruvian (58.6%, a difference of 0.010%), Costa Rican (58.6%, a difference of 0.080%), Immigrants from Philippines (58.7%, a difference of 0.10%), Dutch (58.6%, a difference of 0.10%), and Guamanian/Chamorro (58.6%, a difference of 0.10%).
| Demographics | Rating | Rank | College, 1 year or more |
| South Americans | 35.9 /100 | #185 | Fair 59.0% |
| Scotch-Irish | 34.7 /100 | #186 | Fair 58.9% |
| Germans | 34.7 /100 | #187 | Fair 58.9% |
| French | 34.4 /100 | #188 | Fair 58.9% |
| Uruguayans | 31.8 /100 | #189 | Fair 58.8% |
| Immigrants | Cameroon | 31.2 /100 | #190 | Fair 58.8% |
| Immigrants | Philippines | 29.2 /100 | #191 | Fair 58.7% |
| Colombians | 27.6 /100 | #192 | Fair 58.7% |
| Peruvians | 27.5 /100 | #193 | Fair 58.6% |
| Costa Ricans | 26.4 /100 | #194 | Fair 58.6% |
| Dutch | 26.2 /100 | #195 | Fair 58.6% |
| Guamanians/Chamorros | 26.2 /100 | #196 | Fair 58.6% |
| Immigrants | Thailand | 26.0 /100 | #197 | Fair 58.6% |
| Immigrants | South Eastern Asia | 25.1 /100 | #198 | Fair 58.5% |
| Slovaks | 24.6 /100 | #199 | Fair 58.5% |