Cajun vs Colombian College, 1 year or more
COMPARE
Cajun
Colombian
College, 1 year or more
College, 1 year or more Comparison
Cajuns
Colombians
51.2%
COLLEGE, 1 YEAR OR MORE
0.0/ 100
METRIC RATING
316th/ 347
METRIC RANK
58.7%
COLLEGE, 1 YEAR OR MORE
27.6/ 100
METRIC RATING
192nd/ 347
METRIC RANK
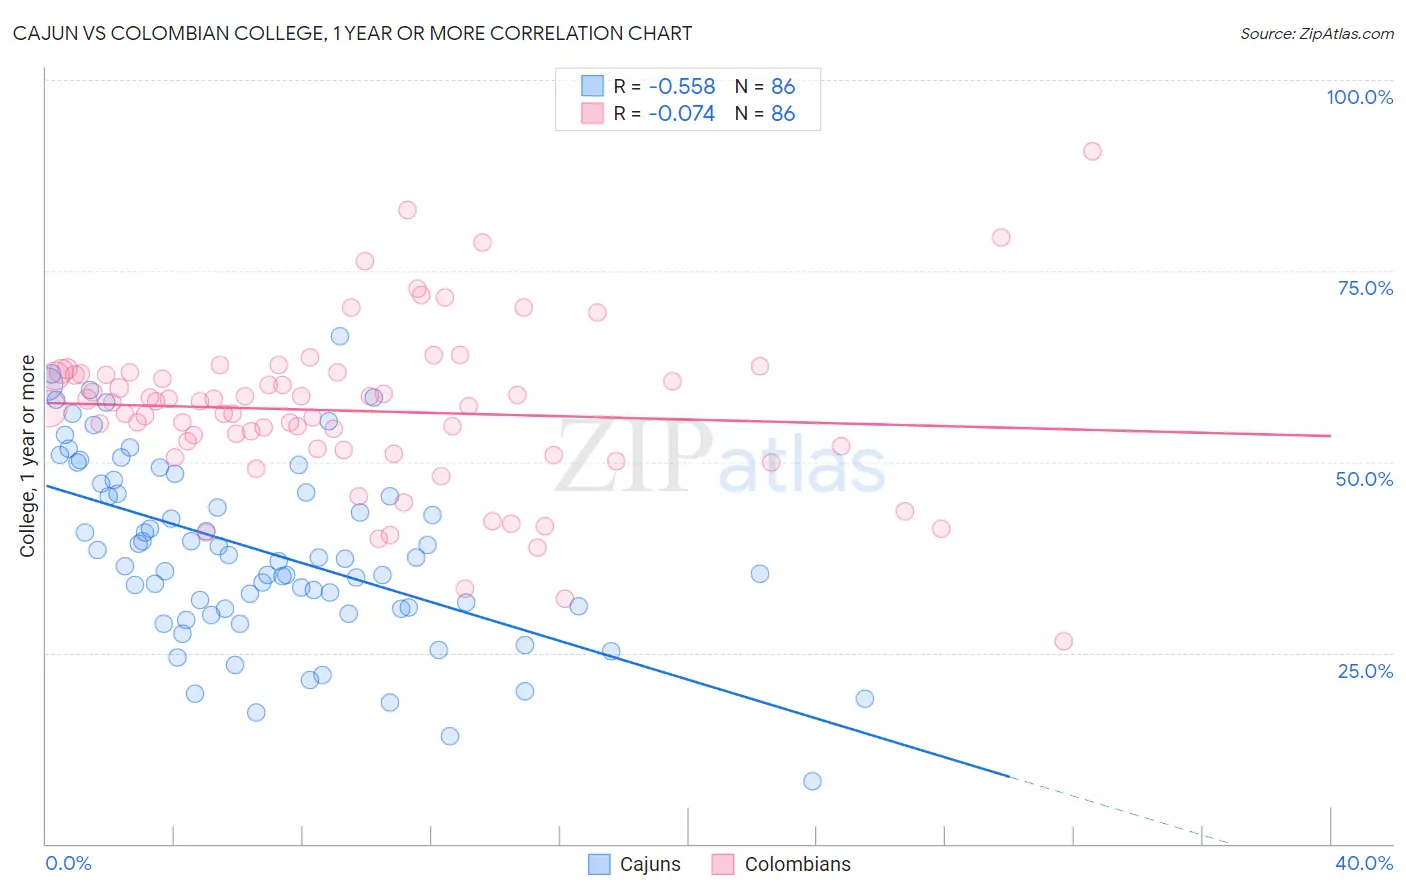
Cajun vs Colombian College, 1 year or more Correlation Chart
The statistical analysis conducted on geographies consisting of 149,712,775 people shows a substantial negative correlation between the proportion of Cajuns and percentage of population with at least college, 1 year or more education in the United States with a correlation coefficient (R) of -0.558 and weighted average of 51.2%. Similarly, the statistical analysis conducted on geographies consisting of 419,698,522 people shows a slight negative correlation between the proportion of Colombians and percentage of population with at least college, 1 year or more education in the United States with a correlation coefficient (R) of -0.074 and weighted average of 58.7%, a difference of 14.6%.
College, 1 year or more Correlation Summary
| Measurement | Cajun | Colombian |
| Minimum | 8.2% | 26.5% |
| Maximum | 66.4% | 90.7% |
| Range | 58.2% | 64.2% |
| Mean | 38.3% | 56.7% |
| Median | 37.4% | 57.6% |
| Interquartile 25% (IQ1) | 30.8% | 51.5% |
| Interquartile 75% (IQ3) | 47.1% | 61.5% |
| Interquartile Range (IQR) | 16.3% | 10.0% |
| Standard Deviation (Sample) | 12.0% | 10.9% |
| Standard Deviation (Population) | 11.9% | 10.8% |
Similar Demographics by College, 1 year or more
Demographics Similar to Cajuns by College, 1 year or more
In terms of college, 1 year or more, the demographic groups most similar to Cajuns are Guatemalan (51.2%, a difference of 0.070%), Hispanic or Latino (51.1%, a difference of 0.090%), Immigrants from Honduras (51.0%, a difference of 0.22%), Fijian (51.3%, a difference of 0.30%), and Immigrants from El Salvador (51.0%, a difference of 0.31%).
| Demographics | Rating | Rank | College, 1 year or more |
| Apache | 0.0 /100 | #309 | Tragic 51.8% |
| Hondurans | 0.0 /100 | #310 | Tragic 51.6% |
| Immigrants | Haiti | 0.0 /100 | #311 | Tragic 51.5% |
| Pueblo | 0.0 /100 | #312 | Tragic 51.5% |
| Immigrants | Caribbean | 0.0 /100 | #313 | Tragic 51.4% |
| Fijians | 0.0 /100 | #314 | Tragic 51.3% |
| Guatemalans | 0.0 /100 | #315 | Tragic 51.2% |
| Cajuns | 0.0 /100 | #316 | Tragic 51.2% |
| Hispanics or Latinos | 0.0 /100 | #317 | Tragic 51.1% |
| Immigrants | Honduras | 0.0 /100 | #318 | Tragic 51.0% |
| Immigrants | El Salvador | 0.0 /100 | #319 | Tragic 51.0% |
| Kiowa | 0.0 /100 | #320 | Tragic 51.0% |
| Hopi | 0.0 /100 | #321 | Tragic 50.9% |
| Navajo | 0.0 /100 | #322 | Tragic 50.8% |
| Immigrants | Guatemala | 0.0 /100 | #323 | Tragic 50.7% |
Demographics Similar to Colombians by College, 1 year or more
In terms of college, 1 year or more, the demographic groups most similar to Colombians are Peruvian (58.6%, a difference of 0.010%), Costa Rican (58.6%, a difference of 0.080%), Immigrants from Philippines (58.7%, a difference of 0.10%), Dutch (58.6%, a difference of 0.10%), and Guamanian/Chamorro (58.6%, a difference of 0.10%).
| Demographics | Rating | Rank | College, 1 year or more |
| South Americans | 35.9 /100 | #185 | Fair 59.0% |
| Scotch-Irish | 34.7 /100 | #186 | Fair 58.9% |
| Germans | 34.7 /100 | #187 | Fair 58.9% |
| French | 34.4 /100 | #188 | Fair 58.9% |
| Uruguayans | 31.8 /100 | #189 | Fair 58.8% |
| Immigrants | Cameroon | 31.2 /100 | #190 | Fair 58.8% |
| Immigrants | Philippines | 29.2 /100 | #191 | Fair 58.7% |
| Colombians | 27.6 /100 | #192 | Fair 58.7% |
| Peruvians | 27.5 /100 | #193 | Fair 58.6% |
| Costa Ricans | 26.4 /100 | #194 | Fair 58.6% |
| Dutch | 26.2 /100 | #195 | Fair 58.6% |
| Guamanians/Chamorros | 26.2 /100 | #196 | Fair 58.6% |
| Immigrants | Thailand | 26.0 /100 | #197 | Fair 58.6% |
| Immigrants | South Eastern Asia | 25.1 /100 | #198 | Fair 58.5% |
| Slovaks | 24.6 /100 | #199 | Fair 58.5% |