Sierra Leonean vs Colombian College, 1 year or more
COMPARE
Sierra Leonean
Colombian
College, 1 year or more
College, 1 year or more Comparison
Sierra Leoneans
Colombians
60.2%
COLLEGE, 1 YEAR OR MORE
74.1/ 100
METRIC RATING
153rd/ 347
METRIC RANK
58.7%
COLLEGE, 1 YEAR OR MORE
27.6/ 100
METRIC RATING
192nd/ 347
METRIC RANK
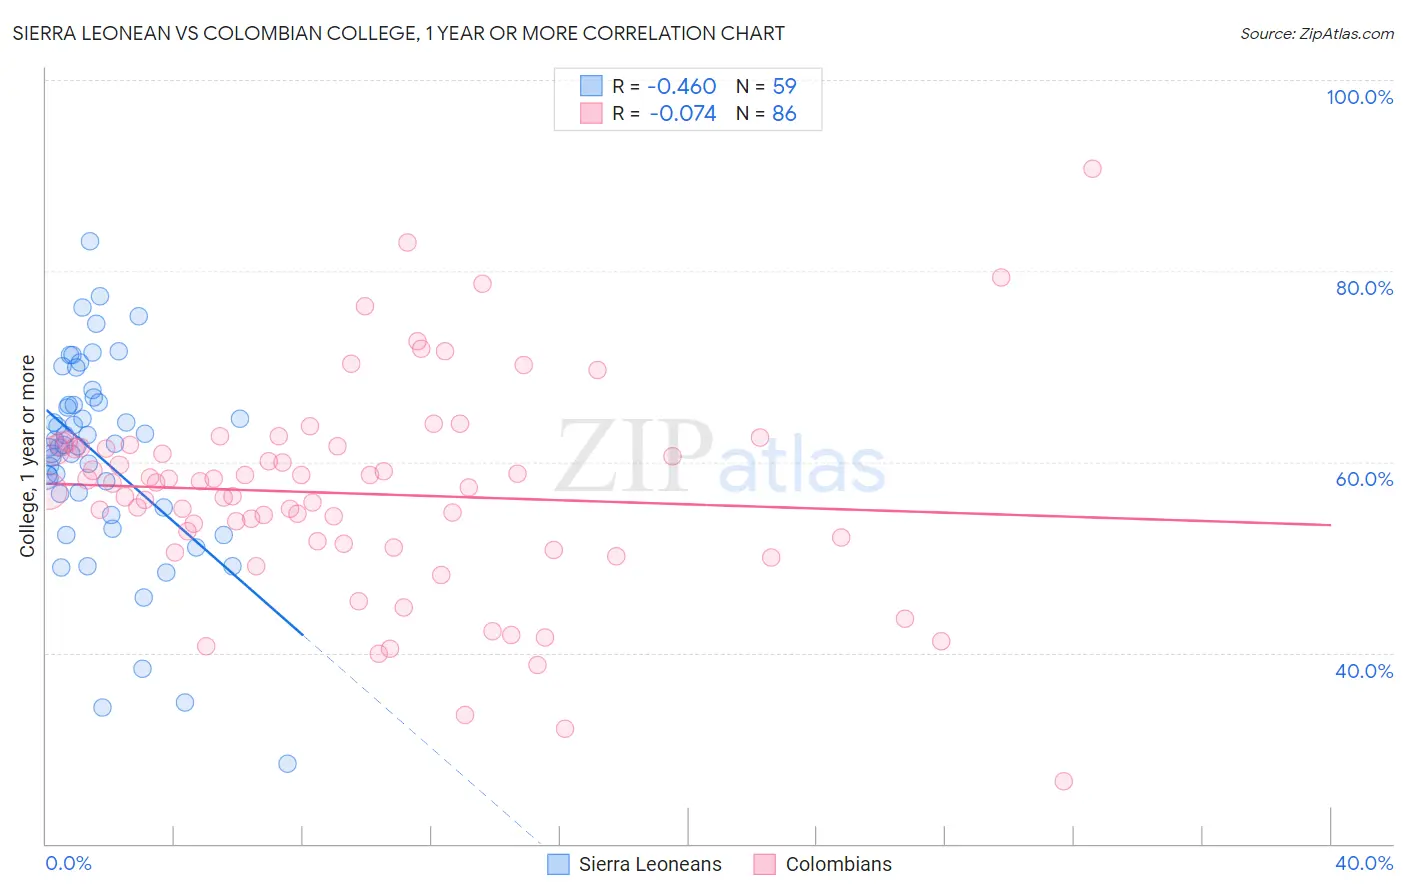
Sierra Leonean vs Colombian College, 1 year or more Correlation Chart
The statistical analysis conducted on geographies consisting of 83,362,711 people shows a moderate negative correlation between the proportion of Sierra Leoneans and percentage of population with at least college, 1 year or more education in the United States with a correlation coefficient (R) of -0.460 and weighted average of 60.2%. Similarly, the statistical analysis conducted on geographies consisting of 419,698,522 people shows a slight negative correlation between the proportion of Colombians and percentage of population with at least college, 1 year or more education in the United States with a correlation coefficient (R) of -0.074 and weighted average of 58.7%, a difference of 2.7%.
College, 1 year or more Correlation Summary
| Measurement | Sierra Leonean | Colombian |
| Minimum | 28.4% | 26.5% |
| Maximum | 83.1% | 90.7% |
| Range | 54.7% | 64.2% |
| Mean | 60.5% | 56.7% |
| Median | 61.8% | 57.6% |
| Interquartile 25% (IQ1) | 55.2% | 51.5% |
| Interquartile 75% (IQ3) | 66.2% | 61.5% |
| Interquartile Range (IQR) | 11.0% | 10.0% |
| Standard Deviation (Sample) | 10.6% | 10.9% |
| Standard Deviation (Population) | 10.5% | 10.8% |
Similar Demographics by College, 1 year or more
Demographics Similar to Sierra Leoneans by College, 1 year or more
In terms of college, 1 year or more, the demographic groups most similar to Sierra Leoneans are Sudanese (60.2%, a difference of 0.080%), Moroccan (60.2%, a difference of 0.080%), Finnish (60.2%, a difference of 0.080%), Immigrants from Germany (60.3%, a difference of 0.14%), and Immigrants from Sudan (60.4%, a difference of 0.27%).
| Demographics | Rating | Rank | College, 1 year or more |
| Scottish | 80.2 /100 | #146 | Excellent 60.5% |
| Immigrants | Kenya | 79.1 /100 | #147 | Good 60.5% |
| Kenyans | 79.0 /100 | #148 | Good 60.5% |
| Brazilians | 79.0 /100 | #149 | Good 60.5% |
| Immigrants | Sudan | 77.8 /100 | #150 | Good 60.4% |
| Albanians | 77.8 /100 | #151 | Good 60.4% |
| Immigrants | Germany | 76.1 /100 | #152 | Good 60.3% |
| Sierra Leoneans | 74.1 /100 | #153 | Good 60.2% |
| Sudanese | 73.0 /100 | #154 | Good 60.2% |
| Moroccans | 72.9 /100 | #155 | Good 60.2% |
| Finns | 72.9 /100 | #156 | Good 60.2% |
| Immigrants | Armenia | 68.8 /100 | #157 | Good 60.0% |
| English | 67.2 /100 | #158 | Good 60.0% |
| Immigrants | Iraq | 67.0 /100 | #159 | Good 60.0% |
| South American Indians | 66.9 /100 | #160 | Good 60.0% |
Demographics Similar to Colombians by College, 1 year or more
In terms of college, 1 year or more, the demographic groups most similar to Colombians are Peruvian (58.6%, a difference of 0.010%), Costa Rican (58.6%, a difference of 0.080%), Immigrants from Philippines (58.7%, a difference of 0.10%), Dutch (58.6%, a difference of 0.10%), and Guamanian/Chamorro (58.6%, a difference of 0.10%).
| Demographics | Rating | Rank | College, 1 year or more |
| South Americans | 35.9 /100 | #185 | Fair 59.0% |
| Scotch-Irish | 34.7 /100 | #186 | Fair 58.9% |
| Germans | 34.7 /100 | #187 | Fair 58.9% |
| French | 34.4 /100 | #188 | Fair 58.9% |
| Uruguayans | 31.8 /100 | #189 | Fair 58.8% |
| Immigrants | Cameroon | 31.2 /100 | #190 | Fair 58.8% |
| Immigrants | Philippines | 29.2 /100 | #191 | Fair 58.7% |
| Colombians | 27.6 /100 | #192 | Fair 58.7% |
| Peruvians | 27.5 /100 | #193 | Fair 58.6% |
| Costa Ricans | 26.4 /100 | #194 | Fair 58.6% |
| Dutch | 26.2 /100 | #195 | Fair 58.6% |
| Guamanians/Chamorros | 26.2 /100 | #196 | Fair 58.6% |
| Immigrants | Thailand | 26.0 /100 | #197 | Fair 58.6% |
| Immigrants | South Eastern Asia | 25.1 /100 | #198 | Fair 58.5% |
| Slovaks | 24.6 /100 | #199 | Fair 58.5% |