Vietnamese vs Mongolian Associate's Degree
COMPARE
Vietnamese
Mongolian
Associate's Degree
Associate's Degree Comparison
Vietnamese
Mongolians
45.8%
ASSOCIATE'S DEGREE
34.0/ 100
METRIC RATING
190th/ 347
METRIC RANK
53.0%
ASSOCIATE'S DEGREE
100.0/ 100
METRIC RATING
38th/ 347
METRIC RANK
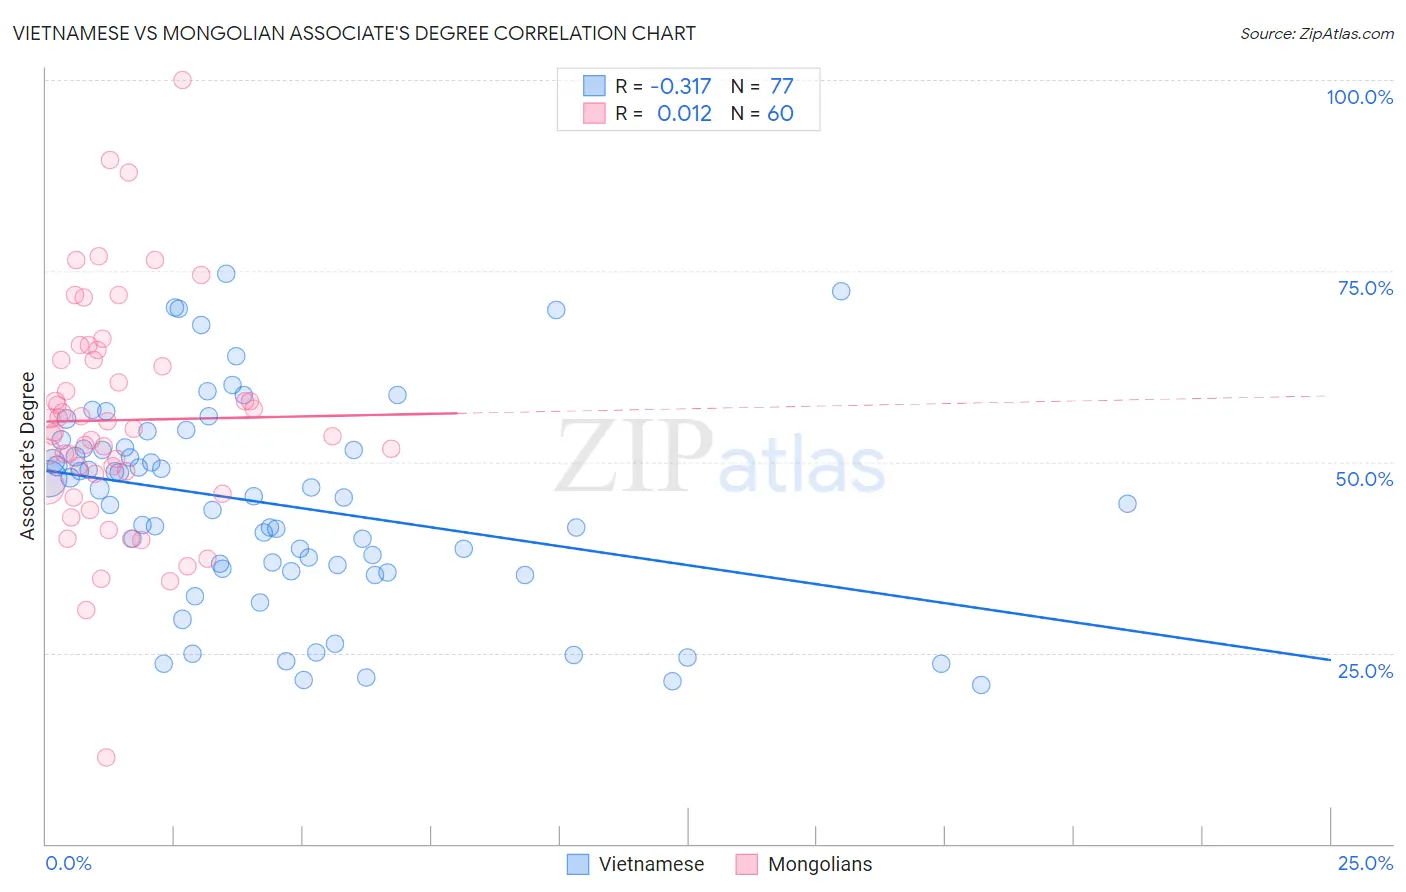
Vietnamese vs Mongolian Associate's Degree Correlation Chart
The statistical analysis conducted on geographies consisting of 170,748,641 people shows a mild negative correlation between the proportion of Vietnamese and percentage of population with at least associate's degree education in the United States with a correlation coefficient (R) of -0.317 and weighted average of 45.8%. Similarly, the statistical analysis conducted on geographies consisting of 140,359,763 people shows no correlation between the proportion of Mongolians and percentage of population with at least associate's degree education in the United States with a correlation coefficient (R) of 0.012 and weighted average of 53.0%, a difference of 15.7%.
Associate's Degree Correlation Summary
| Measurement | Vietnamese | Mongolian |
| Minimum | 20.8% | 11.2% |
| Maximum | 74.6% | 100.0% |
| Range | 53.9% | 88.8% |
| Mean | 44.4% | 55.5% |
| Median | 45.3% | 54.1% |
| Interquartile 25% (IQ1) | 35.8% | 47.6% |
| Interquartile 75% (IQ3) | 51.8% | 63.3% |
| Interquartile Range (IQR) | 16.0% | 15.7% |
| Standard Deviation (Sample) | 13.3% | 15.0% |
| Standard Deviation (Population) | 13.2% | 14.9% |
Similar Demographics by Associate's Degree
Demographics Similar to Vietnamese by Associate's Degree
In terms of associate's degree, the demographic groups most similar to Vietnamese are Korean (45.8%, a difference of 0.020%), Immigrants from Oceania (45.8%, a difference of 0.060%), Celtic (45.8%, a difference of 0.060%), Immigrants from Uruguay (45.8%, a difference of 0.12%), and Ghanaian (45.8%, a difference of 0.12%).
| Demographics | Rating | Rank | Associate's Degree |
| Yugoslavians | 40.2 /100 | #183 | Average 46.0% |
| Czechoslovakians | 40.0 /100 | #184 | Average 46.0% |
| Costa Ricans | 38.6 /100 | #185 | Fair 46.0% |
| Welsh | 37.9 /100 | #186 | Fair 45.9% |
| Immigrants | Uruguay | 35.5 /100 | #187 | Fair 45.8% |
| Ghanaians | 35.5 /100 | #188 | Fair 45.8% |
| Immigrants | Oceania | 34.7 /100 | #189 | Fair 45.8% |
| Vietnamese | 34.0 /100 | #190 | Fair 45.8% |
| Koreans | 33.8 /100 | #191 | Fair 45.8% |
| Celtics | 33.3 /100 | #192 | Fair 45.8% |
| Immigrants | Cameroon | 31.0 /100 | #193 | Fair 45.7% |
| Immigrants | Peru | 27.6 /100 | #194 | Fair 45.5% |
| Germans | 26.5 /100 | #195 | Fair 45.5% |
| French | 25.6 /100 | #196 | Fair 45.4% |
| Scotch-Irish | 22.3 /100 | #197 | Fair 45.3% |
Demographics Similar to Mongolians by Associate's Degree
In terms of associate's degree, the demographic groups most similar to Mongolians are Immigrants from Denmark (53.1%, a difference of 0.16%), Immigrants from Russia (53.1%, a difference of 0.25%), Immigrants from Belarus (52.8%, a difference of 0.29%), Immigrants from Latvia (52.8%, a difference of 0.36%), and Russian (53.2%, a difference of 0.53%).
| Demographics | Rating | Rank | Associate's Degree |
| Immigrants | Northern Europe | 100.0 /100 | #31 | Exceptional 53.5% |
| Immigrants | Turkey | 100.0 /100 | #32 | Exceptional 53.4% |
| Israelis | 100.0 /100 | #33 | Exceptional 53.4% |
| Bulgarians | 100.0 /100 | #34 | Exceptional 53.3% |
| Russians | 100.0 /100 | #35 | Exceptional 53.2% |
| Immigrants | Russia | 100.0 /100 | #36 | Exceptional 53.1% |
| Immigrants | Denmark | 100.0 /100 | #37 | Exceptional 53.1% |
| Mongolians | 100.0 /100 | #38 | Exceptional 53.0% |
| Immigrants | Belarus | 99.9 /100 | #39 | Exceptional 52.8% |
| Immigrants | Latvia | 99.9 /100 | #40 | Exceptional 52.8% |
| Immigrants | Saudi Arabia | 99.9 /100 | #41 | Exceptional 52.6% |
| Immigrants | Malaysia | 99.9 /100 | #42 | Exceptional 52.5% |
| Immigrants | South Africa | 99.9 /100 | #43 | Exceptional 52.5% |
| Estonians | 99.9 /100 | #44 | Exceptional 52.5% |
| Immigrants | Lithuania | 99.9 /100 | #45 | Exceptional 52.4% |