Ute vs Immigrants from Grenada Professional Degree
COMPARE
Ute
Immigrants from Grenada
Professional Degree
Professional Degree Comparison
Ute
Immigrants from Grenada
4.0%
PROFESSIONAL DEGREE
8.2/ 100
METRIC RATING
220th/ 347
METRIC RANK
3.7%
PROFESSIONAL DEGREE
1.5/ 100
METRIC RATING
249th/ 347
METRIC RANK
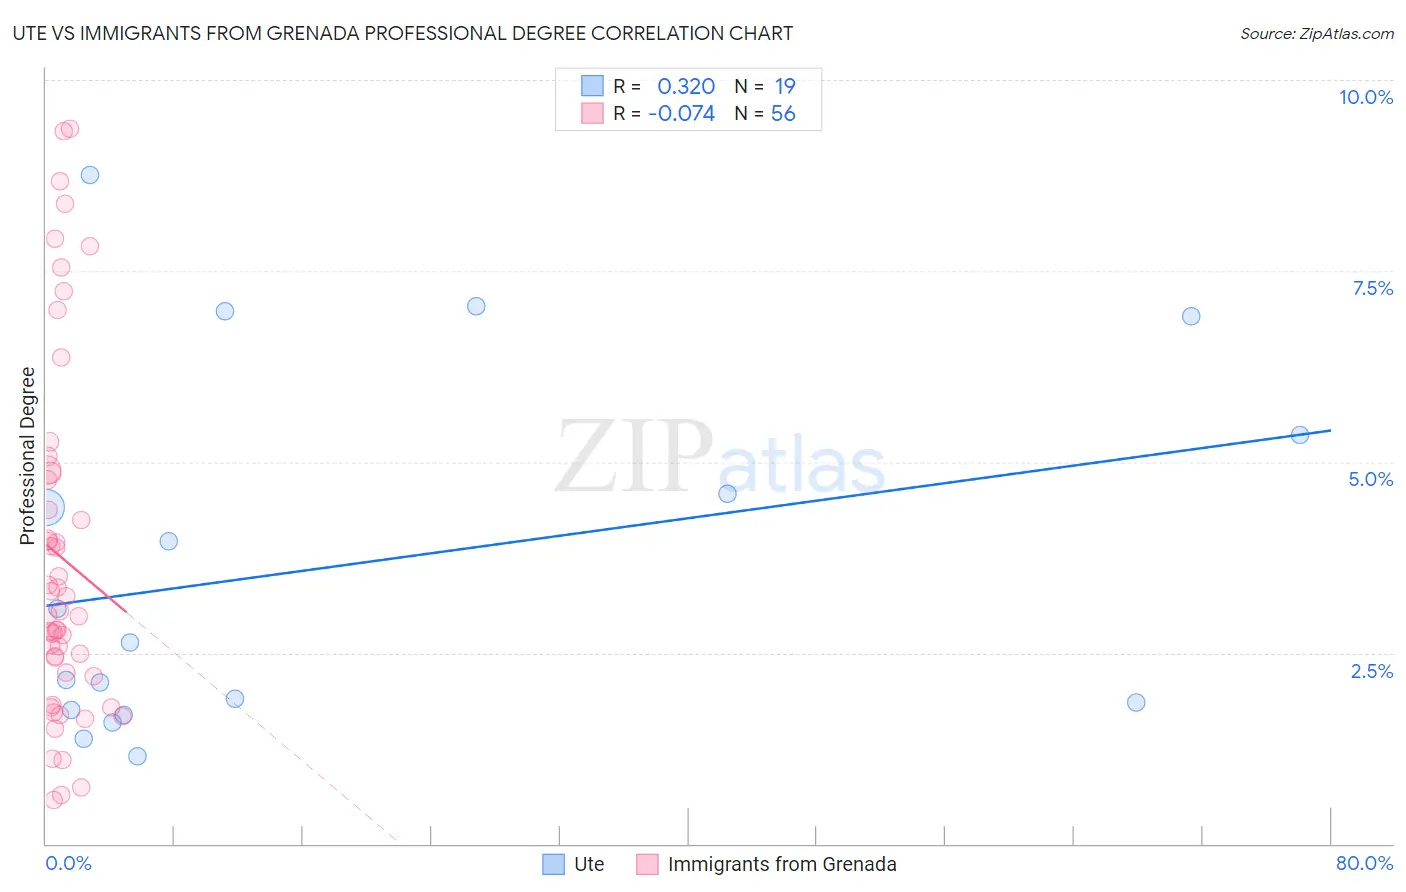
Ute vs Immigrants from Grenada Professional Degree Correlation Chart
The statistical analysis conducted on geographies consisting of 55,594,761 people shows a mild positive correlation between the proportion of Ute and percentage of population with at least professional degree education in the United States with a correlation coefficient (R) of 0.320 and weighted average of 4.0%. Similarly, the statistical analysis conducted on geographies consisting of 67,193,029 people shows a slight negative correlation between the proportion of Immigrants from Grenada and percentage of population with at least professional degree education in the United States with a correlation coefficient (R) of -0.074 and weighted average of 3.7%, a difference of 7.4%.
Professional Degree Correlation Summary
| Measurement | Ute | Immigrants from Grenada |
| Minimum | 1.1% | 0.57% |
| Maximum | 8.7% | 9.4% |
| Range | 7.6% | 8.8% |
| Mean | 3.6% | 3.7% |
| Median | 2.6% | 3.0% |
| Interquartile 25% (IQ1) | 1.8% | 2.2% |
| Interquartile 75% (IQ3) | 5.3% | 4.8% |
| Interquartile Range (IQR) | 3.6% | 2.6% |
| Standard Deviation (Sample) | 2.3% | 2.3% |
| Standard Deviation (Population) | 2.3% | 2.3% |
Similar Demographics by Professional Degree
Demographics Similar to Ute by Professional Degree
In terms of professional degree, the demographic groups most similar to Ute are French Canadian (4.0%, a difference of 0.13%), Immigrants from South Eastern Asia (4.0%, a difference of 0.35%), Immigrants from Western Africa (4.0%, a difference of 0.38%), Dutch (4.0%, a difference of 0.39%), and Immigrants from Bosnia and Herzegovina (4.0%, a difference of 0.46%).
| Demographics | Rating | Rank | Professional Degree |
| Koreans | 10.7 /100 | #213 | Poor 4.1% |
| Immigrants | Ghana | 10.6 /100 | #214 | Poor 4.1% |
| Portuguese | 10.5 /100 | #215 | Poor 4.1% |
| West Indians | 9.8 /100 | #216 | Tragic 4.1% |
| Immigrants | Vietnam | 9.4 /100 | #217 | Tragic 4.0% |
| Dutch | 9.0 /100 | #218 | Tragic 4.0% |
| Immigrants | South Eastern Asia | 8.9 /100 | #219 | Tragic 4.0% |
| Ute | 8.2 /100 | #220 | Tragic 4.0% |
| French Canadians | 8.0 /100 | #221 | Tragic 4.0% |
| Immigrants | Western Africa | 7.5 /100 | #222 | Tragic 4.0% |
| Immigrants | Bosnia and Herzegovina | 7.4 /100 | #223 | Tragic 4.0% |
| Trinidadians and Tobagonians | 7.1 /100 | #224 | Tragic 4.0% |
| Tlingit-Haida | 6.9 /100 | #225 | Tragic 4.0% |
| German Russians | 6.1 /100 | #226 | Tragic 4.0% |
| Cubans | 5.9 /100 | #227 | Tragic 4.0% |
Demographics Similar to Immigrants from Grenada by Professional Degree
In terms of professional degree, the demographic groups most similar to Immigrants from Grenada are Immigrants from Fiji (3.7%, a difference of 0.060%), Hmong (3.7%, a difference of 0.11%), Guyanese (3.8%, a difference of 0.27%), Marshallese (3.8%, a difference of 0.30%), and Immigrants from Nicaragua (3.7%, a difference of 0.31%).
| Demographics | Rating | Rank | Professional Degree |
| Native Hawaiians | 2.3 /100 | #242 | Tragic 3.8% |
| Guamanians/Chamorros | 2.2 /100 | #243 | Tragic 3.8% |
| Immigrants | Bahamas | 2.0 /100 | #244 | Tragic 3.8% |
| French American Indians | 1.7 /100 | #245 | Tragic 3.8% |
| Marshallese | 1.7 /100 | #246 | Tragic 3.8% |
| Guyanese | 1.6 /100 | #247 | Tragic 3.8% |
| Hmong | 1.6 /100 | #248 | Tragic 3.7% |
| Immigrants | Grenada | 1.5 /100 | #249 | Tragic 3.7% |
| Immigrants | Fiji | 1.5 /100 | #250 | Tragic 3.7% |
| Immigrants | Nicaragua | 1.4 /100 | #251 | Tragic 3.7% |
| Jamaicans | 1.4 /100 | #252 | Tragic 3.7% |
| Pueblo | 1.4 /100 | #253 | Tragic 3.7% |
| Tongans | 1.3 /100 | #254 | Tragic 3.7% |
| Osage | 1.2 /100 | #255 | Tragic 3.7% |
| Iroquois | 1.2 /100 | #256 | Tragic 3.7% |