Bulgarian vs Immigrants from Grenada Professional Degree
COMPARE
Bulgarian
Immigrants from Grenada
Professional Degree
Professional Degree Comparison
Bulgarians
Immigrants from Grenada
5.7%
PROFESSIONAL DEGREE
100.0/ 100
METRIC RATING
58th/ 347
METRIC RANK
3.7%
PROFESSIONAL DEGREE
1.5/ 100
METRIC RATING
249th/ 347
METRIC RANK
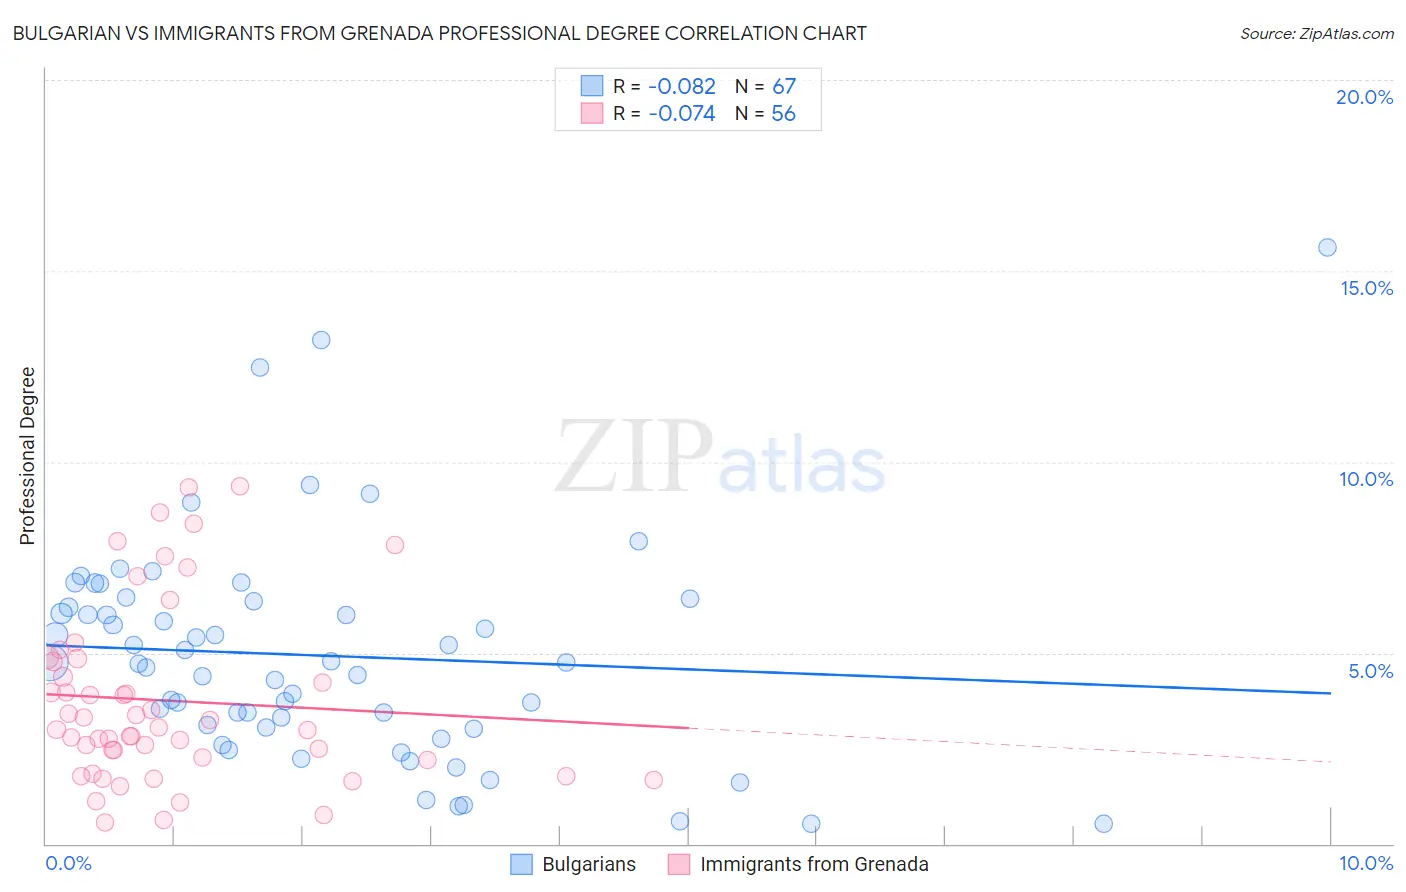
Bulgarian vs Immigrants from Grenada Professional Degree Correlation Chart
The statistical analysis conducted on geographies consisting of 205,448,400 people shows a slight negative correlation between the proportion of Bulgarians and percentage of population with at least professional degree education in the United States with a correlation coefficient (R) of -0.082 and weighted average of 5.7%. Similarly, the statistical analysis conducted on geographies consisting of 67,193,029 people shows a slight negative correlation between the proportion of Immigrants from Grenada and percentage of population with at least professional degree education in the United States with a correlation coefficient (R) of -0.074 and weighted average of 3.7%, a difference of 51.4%.
Professional Degree Correlation Summary
| Measurement | Bulgarian | Immigrants from Grenada |
| Minimum | 0.51% | 0.57% |
| Maximum | 15.6% | 9.4% |
| Range | 15.1% | 8.8% |
| Mean | 4.9% | 3.7% |
| Median | 4.7% | 3.0% |
| Interquartile 25% (IQ1) | 3.1% | 2.2% |
| Interquartile 75% (IQ3) | 6.4% | 4.8% |
| Interquartile Range (IQR) | 3.3% | 2.6% |
| Standard Deviation (Sample) | 2.9% | 2.3% |
| Standard Deviation (Population) | 2.9% | 2.3% |
Similar Demographics by Professional Degree
Demographics Similar to Bulgarians by Professional Degree
In terms of professional degree, the demographic groups most similar to Bulgarians are Immigrants from Europe (5.6%, a difference of 0.52%), South African (5.7%, a difference of 0.59%), Immigrants from Malaysia (5.7%, a difference of 0.86%), Bolivian (5.6%, a difference of 0.94%), and Immigrants from Western Europe (5.7%, a difference of 0.98%).
| Demographics | Rating | Rank | Professional Degree |
| Immigrants | Greece | 100.0 /100 | #51 | Exceptional 5.8% |
| Immigrants | Serbia | 100.0 /100 | #52 | Exceptional 5.8% |
| Immigrants | Netherlands | 100.0 /100 | #53 | Exceptional 5.8% |
| Immigrants | Kuwait | 100.0 /100 | #54 | Exceptional 5.7% |
| Immigrants | Western Europe | 100.0 /100 | #55 | Exceptional 5.7% |
| Immigrants | Malaysia | 100.0 /100 | #56 | Exceptional 5.7% |
| South Africans | 100.0 /100 | #57 | Exceptional 5.7% |
| Bulgarians | 100.0 /100 | #58 | Exceptional 5.7% |
| Immigrants | Europe | 100.0 /100 | #59 | Exceptional 5.6% |
| Bolivians | 99.9 /100 | #60 | Exceptional 5.6% |
| Immigrants | Lithuania | 99.9 /100 | #61 | Exceptional 5.6% |
| Immigrants | Belarus | 99.9 /100 | #62 | Exceptional 5.5% |
| Asians | 99.9 /100 | #63 | Exceptional 5.5% |
| Immigrants | Asia | 99.9 /100 | #64 | Exceptional 5.5% |
| Immigrants | Bolivia | 99.9 /100 | #65 | Exceptional 5.5% |
Demographics Similar to Immigrants from Grenada by Professional Degree
In terms of professional degree, the demographic groups most similar to Immigrants from Grenada are Immigrants from Fiji (3.7%, a difference of 0.060%), Hmong (3.7%, a difference of 0.11%), Guyanese (3.8%, a difference of 0.27%), Marshallese (3.8%, a difference of 0.30%), and Immigrants from Nicaragua (3.7%, a difference of 0.31%).
| Demographics | Rating | Rank | Professional Degree |
| Native Hawaiians | 2.3 /100 | #242 | Tragic 3.8% |
| Guamanians/Chamorros | 2.2 /100 | #243 | Tragic 3.8% |
| Immigrants | Bahamas | 2.0 /100 | #244 | Tragic 3.8% |
| French American Indians | 1.7 /100 | #245 | Tragic 3.8% |
| Marshallese | 1.7 /100 | #246 | Tragic 3.8% |
| Guyanese | 1.6 /100 | #247 | Tragic 3.8% |
| Hmong | 1.6 /100 | #248 | Tragic 3.7% |
| Immigrants | Grenada | 1.5 /100 | #249 | Tragic 3.7% |
| Immigrants | Fiji | 1.5 /100 | #250 | Tragic 3.7% |
| Immigrants | Nicaragua | 1.4 /100 | #251 | Tragic 3.7% |
| Jamaicans | 1.4 /100 | #252 | Tragic 3.7% |
| Pueblo | 1.4 /100 | #253 | Tragic 3.7% |
| Tongans | 1.3 /100 | #254 | Tragic 3.7% |
| Osage | 1.2 /100 | #255 | Tragic 3.7% |
| Iroquois | 1.2 /100 | #256 | Tragic 3.7% |