Venezuelan vs Immigrants from Zimbabwe Bachelor's Degree
COMPARE
Venezuelan
Immigrants from Zimbabwe
Bachelor's Degree
Bachelor's Degree Comparison
Venezuelans
Immigrants from Zimbabwe
40.5%
BACHELOR'S DEGREE
94.7/ 100
METRIC RATING
120th/ 347
METRIC RANK
42.6%
BACHELOR'S DEGREE
99.4/ 100
METRIC RATING
75th/ 347
METRIC RANK
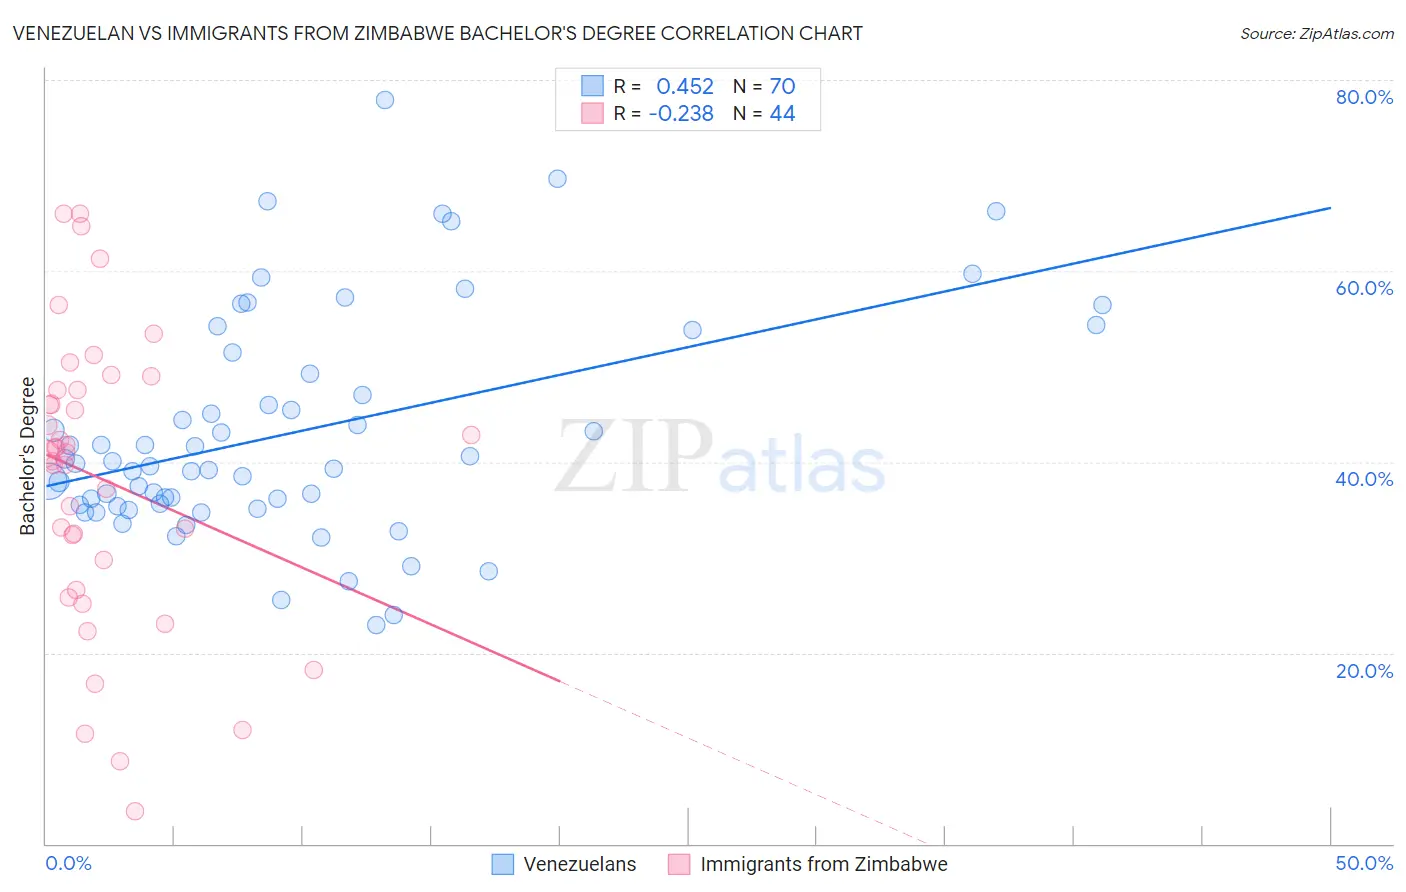
Venezuelan vs Immigrants from Zimbabwe Bachelor's Degree Correlation Chart
The statistical analysis conducted on geographies consisting of 306,305,141 people shows a moderate positive correlation between the proportion of Venezuelans and percentage of population with at least bachelor's degree education in the United States with a correlation coefficient (R) of 0.452 and weighted average of 40.5%. Similarly, the statistical analysis conducted on geographies consisting of 117,809,864 people shows a weak negative correlation between the proportion of Immigrants from Zimbabwe and percentage of population with at least bachelor's degree education in the United States with a correlation coefficient (R) of -0.238 and weighted average of 42.6%, a difference of 5.2%.
Bachelor's Degree Correlation Summary
| Measurement | Venezuelan | Immigrants from Zimbabwe |
| Minimum | 22.9% | 3.5% |
| Maximum | 77.9% | 66.0% |
| Range | 55.1% | 62.5% |
| Mean | 43.1% | 38.2% |
| Median | 39.7% | 40.9% |
| Interquartile 25% (IQ1) | 35.5% | 28.1% |
| Interquartile 75% (IQ3) | 49.3% | 47.5% |
| Interquartile Range (IQR) | 13.8% | 19.4% |
| Standard Deviation (Sample) | 11.7% | 15.1% |
| Standard Deviation (Population) | 11.6% | 15.0% |
Similar Demographics by Bachelor's Degree
Demographics Similar to Venezuelans by Bachelor's Degree
In terms of bachelor's degree, the demographic groups most similar to Venezuelans are Moroccan (40.5%, a difference of 0.050%), Immigrants from Syria (40.5%, a difference of 0.070%), Immigrants from Albania (40.4%, a difference of 0.15%), Lebanese (40.4%, a difference of 0.17%), and Immigrants from Eritrea (40.4%, a difference of 0.17%).
| Demographics | Rating | Rank | Bachelor's Degree |
| Brazilians | 96.3 /100 | #113 | Exceptional 40.8% |
| Afghans | 96.2 /100 | #114 | Exceptional 40.8% |
| Palestinians | 95.8 /100 | #115 | Exceptional 40.7% |
| Immigrants | Uganda | 95.7 /100 | #116 | Exceptional 40.7% |
| Austrians | 95.5 /100 | #117 | Exceptional 40.6% |
| Croatians | 95.5 /100 | #118 | Exceptional 40.6% |
| Immigrants | Syria | 94.9 /100 | #119 | Exceptional 40.5% |
| Venezuelans | 94.7 /100 | #120 | Exceptional 40.5% |
| Moroccans | 94.6 /100 | #121 | Exceptional 40.5% |
| Immigrants | Albania | 94.4 /100 | #122 | Exceptional 40.4% |
| Lebanese | 94.3 /100 | #123 | Exceptional 40.4% |
| Immigrants | Eritrea | 94.3 /100 | #124 | Exceptional 40.4% |
| British | 94.2 /100 | #125 | Exceptional 40.4% |
| Immigrants | Eastern Africa | 94.1 /100 | #126 | Exceptional 40.4% |
| Immigrants | Jordan | 93.4 /100 | #127 | Exceptional 40.3% |
Demographics Similar to Immigrants from Zimbabwe by Bachelor's Degree
In terms of bachelor's degree, the demographic groups most similar to Immigrants from Zimbabwe are Immigrants from Egypt (42.6%, a difference of 0.020%), Immigrants from Eastern Europe (42.5%, a difference of 0.20%), Bhutanese (42.7%, a difference of 0.21%), Immigrants from Ethiopia (42.5%, a difference of 0.26%), and Immigrants from Lebanon (42.4%, a difference of 0.42%).
| Demographics | Rating | Rank | Bachelor's Degree |
| Immigrants | Indonesia | 99.7 /100 | #68 | Exceptional 43.3% |
| Immigrants | Pakistan | 99.7 /100 | #69 | Exceptional 43.1% |
| Immigrants | Romania | 99.6 /100 | #70 | Exceptional 42.9% |
| Immigrants | Argentina | 99.6 /100 | #71 | Exceptional 42.8% |
| Ethiopians | 99.5 /100 | #72 | Exceptional 42.8% |
| Immigrants | Uzbekistan | 99.5 /100 | #73 | Exceptional 42.8% |
| Bhutanese | 99.5 /100 | #74 | Exceptional 42.7% |
| Immigrants | Zimbabwe | 99.4 /100 | #75 | Exceptional 42.6% |
| Immigrants | Egypt | 99.4 /100 | #76 | Exceptional 42.6% |
| Immigrants | Eastern Europe | 99.4 /100 | #77 | Exceptional 42.5% |
| Immigrants | Ethiopia | 99.4 /100 | #78 | Exceptional 42.5% |
| Immigrants | Lebanon | 99.3 /100 | #79 | Exceptional 42.4% |
| Immigrants | Croatia | 99.2 /100 | #80 | Exceptional 42.3% |
| Immigrants | Hungary | 99.2 /100 | #81 | Exceptional 42.3% |
| Immigrants | Scotland | 99.2 /100 | #82 | Exceptional 42.3% |