Bolivian vs Immigrants from Zimbabwe Bachelor's Degree
COMPARE
Bolivian
Immigrants from Zimbabwe
Bachelor's Degree
Bachelor's Degree Comparison
Bolivians
Immigrants from Zimbabwe
44.6%
BACHELOR'S DEGREE
99.9/ 100
METRIC RATING
47th/ 347
METRIC RANK
42.6%
BACHELOR'S DEGREE
99.4/ 100
METRIC RATING
75th/ 347
METRIC RANK
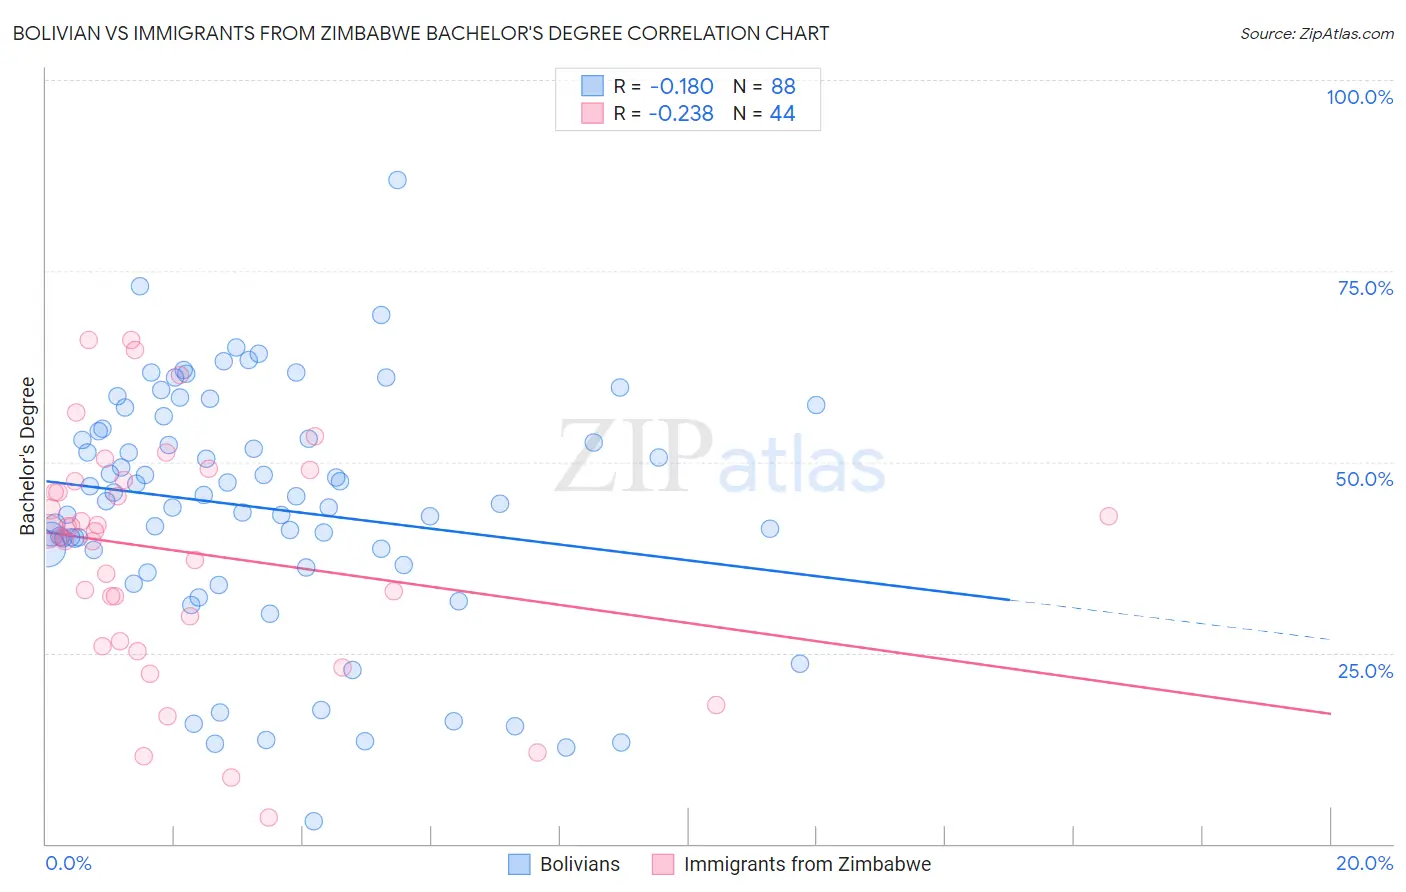
Bolivian vs Immigrants from Zimbabwe Bachelor's Degree Correlation Chart
The statistical analysis conducted on geographies consisting of 184,660,995 people shows a poor negative correlation between the proportion of Bolivians and percentage of population with at least bachelor's degree education in the United States with a correlation coefficient (R) of -0.180 and weighted average of 44.6%. Similarly, the statistical analysis conducted on geographies consisting of 117,809,864 people shows a weak negative correlation between the proportion of Immigrants from Zimbabwe and percentage of population with at least bachelor's degree education in the United States with a correlation coefficient (R) of -0.238 and weighted average of 42.6%, a difference of 4.7%.
Bachelor's Degree Correlation Summary
| Measurement | Bolivian | Immigrants from Zimbabwe |
| Minimum | 2.9% | 3.5% |
| Maximum | 86.9% | 66.0% |
| Range | 83.9% | 62.5% |
| Mean | 44.0% | 38.2% |
| Median | 45.2% | 40.9% |
| Interquartile 25% (IQ1) | 37.5% | 28.1% |
| Interquartile 75% (IQ3) | 54.2% | 47.5% |
| Interquartile Range (IQR) | 16.7% | 19.4% |
| Standard Deviation (Sample) | 15.8% | 15.1% |
| Standard Deviation (Population) | 15.7% | 15.0% |
Similar Demographics by Bachelor's Degree
Demographics Similar to Bolivians by Bachelor's Degree
In terms of bachelor's degree, the demographic groups most similar to Bolivians are Estonian (44.6%, a difference of 0.0%), Immigrants from Bulgaria (44.6%, a difference of 0.040%), Immigrants from Kuwait (44.6%, a difference of 0.090%), Immigrants from Lithuania (44.6%, a difference of 0.12%), and Immigrants from Norway (44.5%, a difference of 0.12%).
| Demographics | Rating | Rank | Bachelor's Degree |
| Immigrants | Belarus | 100.0 /100 | #40 | Exceptional 45.0% |
| Immigrants | Malaysia | 100.0 /100 | #41 | Exceptional 45.0% |
| Immigrants | Saudi Arabia | 100.0 /100 | #42 | Exceptional 44.8% |
| Immigrants | South Africa | 99.9 /100 | #43 | Exceptional 44.8% |
| Immigrants | Lithuania | 99.9 /100 | #44 | Exceptional 44.6% |
| Immigrants | Kuwait | 99.9 /100 | #45 | Exceptional 44.6% |
| Immigrants | Bulgaria | 99.9 /100 | #46 | Exceptional 44.6% |
| Bolivians | 99.9 /100 | #47 | Exceptional 44.6% |
| Estonians | 99.9 /100 | #48 | Exceptional 44.6% |
| Immigrants | Norway | 99.9 /100 | #49 | Exceptional 44.5% |
| Immigrants | Greece | 99.9 /100 | #50 | Exceptional 44.5% |
| Asians | 99.9 /100 | #51 | Exceptional 44.4% |
| Immigrants | Spain | 99.9 /100 | #52 | Exceptional 44.3% |
| Immigrants | Asia | 99.9 /100 | #53 | Exceptional 44.3% |
| Immigrants | Austria | 99.9 /100 | #54 | Exceptional 44.2% |
Demographics Similar to Immigrants from Zimbabwe by Bachelor's Degree
In terms of bachelor's degree, the demographic groups most similar to Immigrants from Zimbabwe are Immigrants from Egypt (42.6%, a difference of 0.020%), Immigrants from Eastern Europe (42.5%, a difference of 0.20%), Bhutanese (42.7%, a difference of 0.21%), Immigrants from Ethiopia (42.5%, a difference of 0.26%), and Immigrants from Lebanon (42.4%, a difference of 0.42%).
| Demographics | Rating | Rank | Bachelor's Degree |
| Immigrants | Indonesia | 99.7 /100 | #68 | Exceptional 43.3% |
| Immigrants | Pakistan | 99.7 /100 | #69 | Exceptional 43.1% |
| Immigrants | Romania | 99.6 /100 | #70 | Exceptional 42.9% |
| Immigrants | Argentina | 99.6 /100 | #71 | Exceptional 42.8% |
| Ethiopians | 99.5 /100 | #72 | Exceptional 42.8% |
| Immigrants | Uzbekistan | 99.5 /100 | #73 | Exceptional 42.8% |
| Bhutanese | 99.5 /100 | #74 | Exceptional 42.7% |
| Immigrants | Zimbabwe | 99.4 /100 | #75 | Exceptional 42.6% |
| Immigrants | Egypt | 99.4 /100 | #76 | Exceptional 42.6% |
| Immigrants | Eastern Europe | 99.4 /100 | #77 | Exceptional 42.5% |
| Immigrants | Ethiopia | 99.4 /100 | #78 | Exceptional 42.5% |
| Immigrants | Lebanon | 99.3 /100 | #79 | Exceptional 42.4% |
| Immigrants | Croatia | 99.2 /100 | #80 | Exceptional 42.3% |
| Immigrants | Hungary | 99.2 /100 | #81 | Exceptional 42.3% |
| Immigrants | Scotland | 99.2 /100 | #82 | Exceptional 42.3% |