Venezuelan vs Nicaraguan Bachelor's Degree
COMPARE
Venezuelan
Nicaraguan
Bachelor's Degree
Bachelor's Degree Comparison
Venezuelans
Nicaraguans
40.5%
BACHELOR'S DEGREE
94.7/ 100
METRIC RATING
120th/ 347
METRIC RANK
33.1%
BACHELOR'S DEGREE
0.6/ 100
METRIC RATING
256th/ 347
METRIC RANK
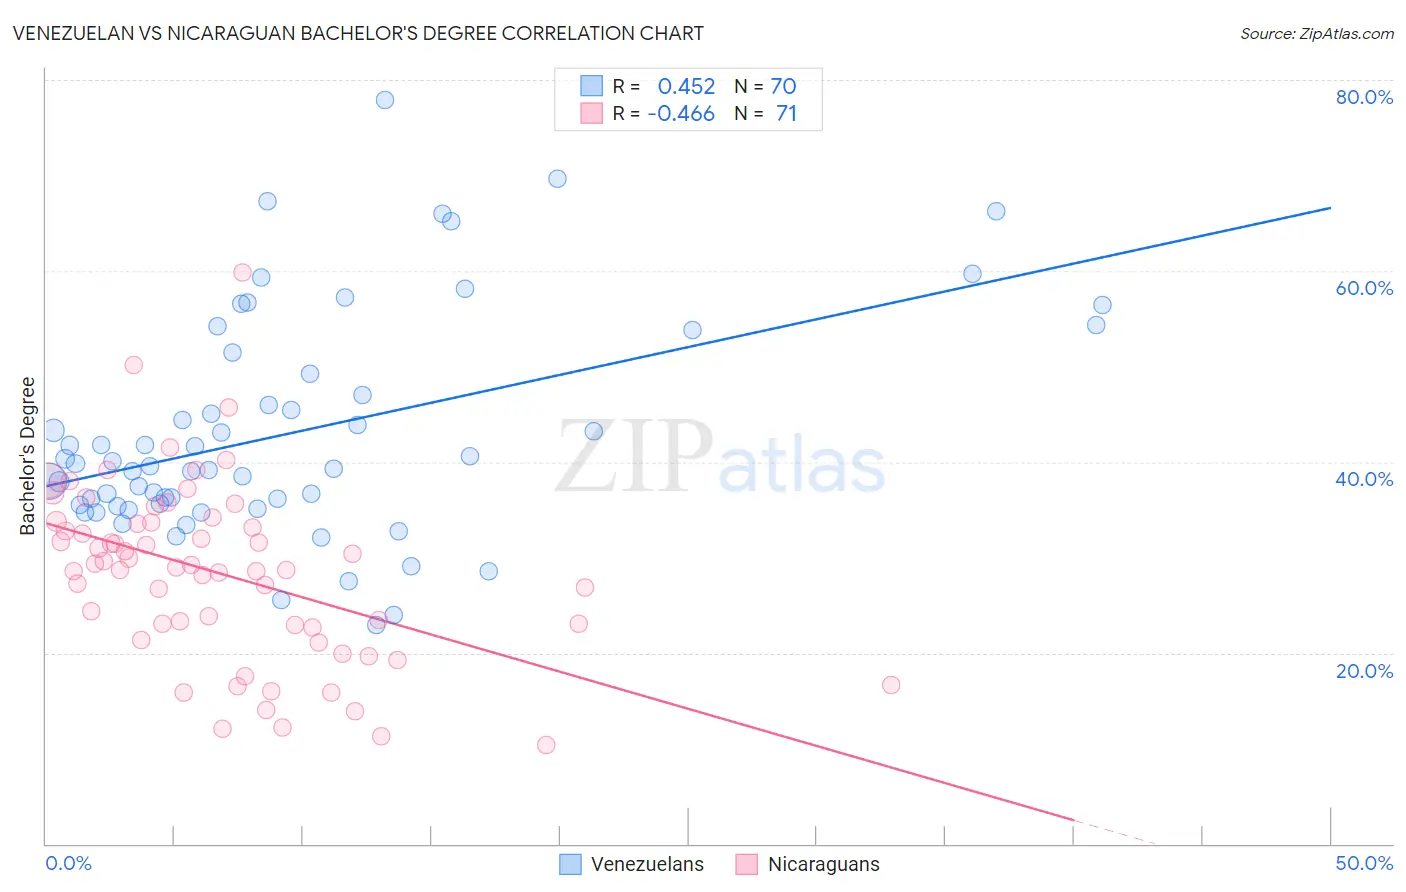
Venezuelan vs Nicaraguan Bachelor's Degree Correlation Chart
The statistical analysis conducted on geographies consisting of 306,305,141 people shows a moderate positive correlation between the proportion of Venezuelans and percentage of population with at least bachelor's degree education in the United States with a correlation coefficient (R) of 0.452 and weighted average of 40.5%. Similarly, the statistical analysis conducted on geographies consisting of 285,704,287 people shows a moderate negative correlation between the proportion of Nicaraguans and percentage of population with at least bachelor's degree education in the United States with a correlation coefficient (R) of -0.466 and weighted average of 33.1%, a difference of 22.1%.
Bachelor's Degree Correlation Summary
| Measurement | Venezuelan | Nicaraguan |
| Minimum | 22.9% | 10.4% |
| Maximum | 77.9% | 59.8% |
| Range | 55.1% | 49.4% |
| Mean | 43.1% | 28.3% |
| Median | 39.7% | 29.0% |
| Interquartile 25% (IQ1) | 35.5% | 22.7% |
| Interquartile 75% (IQ3) | 49.3% | 33.7% |
| Interquartile Range (IQR) | 13.8% | 11.0% |
| Standard Deviation (Sample) | 11.7% | 9.3% |
| Standard Deviation (Population) | 11.6% | 9.3% |
Similar Demographics by Bachelor's Degree
Demographics Similar to Venezuelans by Bachelor's Degree
In terms of bachelor's degree, the demographic groups most similar to Venezuelans are Moroccan (40.5%, a difference of 0.050%), Immigrants from Syria (40.5%, a difference of 0.070%), Immigrants from Albania (40.4%, a difference of 0.15%), Lebanese (40.4%, a difference of 0.17%), and Immigrants from Eritrea (40.4%, a difference of 0.17%).
| Demographics | Rating | Rank | Bachelor's Degree |
| Brazilians | 96.3 /100 | #113 | Exceptional 40.8% |
| Afghans | 96.2 /100 | #114 | Exceptional 40.8% |
| Palestinians | 95.8 /100 | #115 | Exceptional 40.7% |
| Immigrants | Uganda | 95.7 /100 | #116 | Exceptional 40.7% |
| Austrians | 95.5 /100 | #117 | Exceptional 40.6% |
| Croatians | 95.5 /100 | #118 | Exceptional 40.6% |
| Immigrants | Syria | 94.9 /100 | #119 | Exceptional 40.5% |
| Venezuelans | 94.7 /100 | #120 | Exceptional 40.5% |
| Moroccans | 94.6 /100 | #121 | Exceptional 40.5% |
| Immigrants | Albania | 94.4 /100 | #122 | Exceptional 40.4% |
| Lebanese | 94.3 /100 | #123 | Exceptional 40.4% |
| Immigrants | Eritrea | 94.3 /100 | #124 | Exceptional 40.4% |
| British | 94.2 /100 | #125 | Exceptional 40.4% |
| Immigrants | Eastern Africa | 94.1 /100 | #126 | Exceptional 40.4% |
| Immigrants | Jordan | 93.4 /100 | #127 | Exceptional 40.3% |
Demographics Similar to Nicaraguans by Bachelor's Degree
In terms of bachelor's degree, the demographic groups most similar to Nicaraguans are Iroquois (33.2%, a difference of 0.19%), Native Hawaiian (33.2%, a difference of 0.20%), Spanish American (33.1%, a difference of 0.22%), French American Indian (33.1%, a difference of 0.26%), and U.S. Virgin Islander (33.2%, a difference of 0.27%).
| Demographics | Rating | Rank | Bachelor's Degree |
| Immigrants | Liberia | 0.9 /100 | #249 | Tragic 33.5% |
| Indonesians | 0.9 /100 | #250 | Tragic 33.5% |
| Japanese | 0.7 /100 | #251 | Tragic 33.3% |
| Immigrants | Bahamas | 0.7 /100 | #252 | Tragic 33.3% |
| U.S. Virgin Islanders | 0.7 /100 | #253 | Tragic 33.2% |
| Native Hawaiians | 0.7 /100 | #254 | Tragic 33.2% |
| Iroquois | 0.7 /100 | #255 | Tragic 33.2% |
| Nicaraguans | 0.6 /100 | #256 | Tragic 33.1% |
| Spanish Americans | 0.6 /100 | #257 | Tragic 33.1% |
| French American Indians | 0.6 /100 | #258 | Tragic 33.1% |
| Osage | 0.5 /100 | #259 | Tragic 33.0% |
| Malaysians | 0.5 /100 | #260 | Tragic 32.9% |
| Africans | 0.5 /100 | #261 | Tragic 32.9% |
| Immigrants | Jamaica | 0.5 /100 | #262 | Tragic 32.9% |
| Belizeans | 0.4 /100 | #263 | Tragic 32.8% |