Venezuelan vs Maltese Bachelor's Degree
COMPARE
Venezuelan
Maltese
Bachelor's Degree
Bachelor's Degree Comparison
Venezuelans
Maltese
40.5%
BACHELOR'S DEGREE
94.7/ 100
METRIC RATING
120th/ 347
METRIC RANK
41.9%
BACHELOR'S DEGREE
98.8/ 100
METRIC RATING
92nd/ 347
METRIC RANK
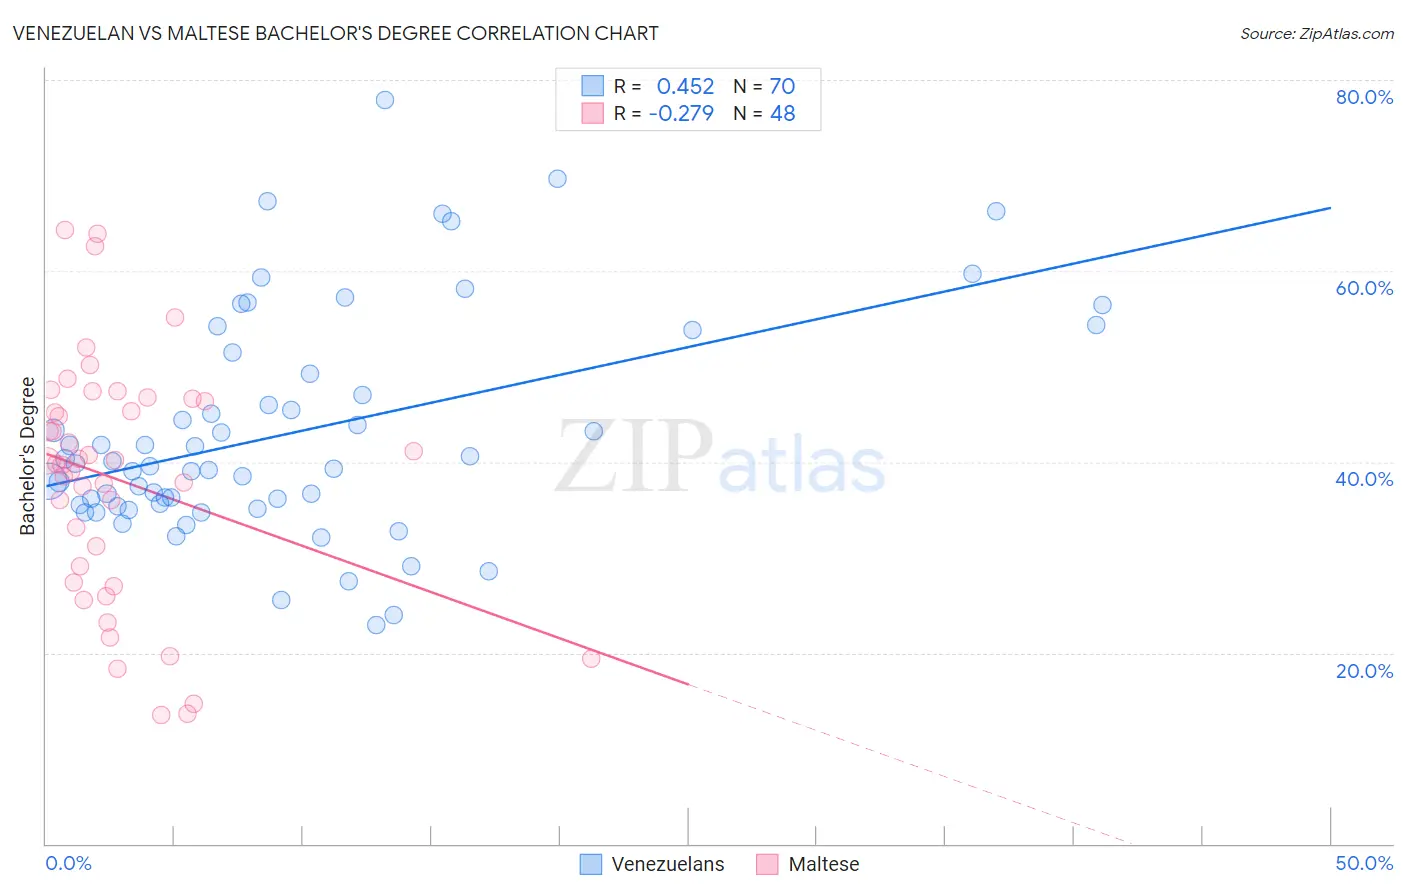
Venezuelan vs Maltese Bachelor's Degree Correlation Chart
The statistical analysis conducted on geographies consisting of 306,305,141 people shows a moderate positive correlation between the proportion of Venezuelans and percentage of population with at least bachelor's degree education in the United States with a correlation coefficient (R) of 0.452 and weighted average of 40.5%. Similarly, the statistical analysis conducted on geographies consisting of 126,471,941 people shows a weak negative correlation between the proportion of Maltese and percentage of population with at least bachelor's degree education in the United States with a correlation coefficient (R) of -0.279 and weighted average of 41.9%, a difference of 3.5%.
Bachelor's Degree Correlation Summary
| Measurement | Venezuelan | Maltese |
| Minimum | 22.9% | 13.5% |
| Maximum | 77.9% | 64.2% |
| Range | 55.1% | 50.8% |
| Mean | 43.1% | 38.1% |
| Median | 39.7% | 40.0% |
| Interquartile 25% (IQ1) | 35.5% | 28.2% |
| Interquartile 75% (IQ3) | 49.3% | 46.4% |
| Interquartile Range (IQR) | 13.8% | 18.3% |
| Standard Deviation (Sample) | 11.7% | 12.6% |
| Standard Deviation (Population) | 11.6% | 12.5% |
Similar Demographics by Bachelor's Degree
Demographics Similar to Venezuelans by Bachelor's Degree
In terms of bachelor's degree, the demographic groups most similar to Venezuelans are Moroccan (40.5%, a difference of 0.050%), Immigrants from Syria (40.5%, a difference of 0.070%), Immigrants from Albania (40.4%, a difference of 0.15%), Lebanese (40.4%, a difference of 0.17%), and Immigrants from Eritrea (40.4%, a difference of 0.17%).
| Demographics | Rating | Rank | Bachelor's Degree |
| Brazilians | 96.3 /100 | #113 | Exceptional 40.8% |
| Afghans | 96.2 /100 | #114 | Exceptional 40.8% |
| Palestinians | 95.8 /100 | #115 | Exceptional 40.7% |
| Immigrants | Uganda | 95.7 /100 | #116 | Exceptional 40.7% |
| Austrians | 95.5 /100 | #117 | Exceptional 40.6% |
| Croatians | 95.5 /100 | #118 | Exceptional 40.6% |
| Immigrants | Syria | 94.9 /100 | #119 | Exceptional 40.5% |
| Venezuelans | 94.7 /100 | #120 | Exceptional 40.5% |
| Moroccans | 94.6 /100 | #121 | Exceptional 40.5% |
| Immigrants | Albania | 94.4 /100 | #122 | Exceptional 40.4% |
| Lebanese | 94.3 /100 | #123 | Exceptional 40.4% |
| Immigrants | Eritrea | 94.3 /100 | #124 | Exceptional 40.4% |
| British | 94.2 /100 | #125 | Exceptional 40.4% |
| Immigrants | Eastern Africa | 94.1 /100 | #126 | Exceptional 40.4% |
| Immigrants | Jordan | 93.4 /100 | #127 | Exceptional 40.3% |
Demographics Similar to Maltese by Bachelor's Degree
In terms of bachelor's degree, the demographic groups most similar to Maltese are Immigrants from Northern Africa (41.9%, a difference of 0.070%), Laotian (42.0%, a difference of 0.17%), Immigrants from Western Europe (42.0%, a difference of 0.30%), Greek (42.0%, a difference of 0.30%), and Carpatho Rusyn (42.1%, a difference of 0.42%).
| Demographics | Rating | Rank | Bachelor's Degree |
| Lithuanians | 99.2 /100 | #85 | Exceptional 42.2% |
| Immigrants | Brazil | 99.2 /100 | #86 | Exceptional 42.2% |
| Carpatho Rusyns | 99.0 /100 | #87 | Exceptional 42.1% |
| Immigrants | Western Europe | 99.0 /100 | #88 | Exceptional 42.0% |
| Greeks | 99.0 /100 | #89 | Exceptional 42.0% |
| Laotians | 98.9 /100 | #90 | Exceptional 42.0% |
| Immigrants | Northern Africa | 98.9 /100 | #91 | Exceptional 41.9% |
| Maltese | 98.8 /100 | #92 | Exceptional 41.9% |
| Immigrants | Canada | 98.6 /100 | #93 | Exceptional 41.7% |
| Immigrants | Nepal | 98.6 /100 | #94 | Exceptional 41.7% |
| Immigrants | North America | 98.5 /100 | #95 | Exceptional 41.7% |
| Immigrants | Moldova | 98.4 /100 | #96 | Exceptional 41.6% |
| Romanians | 98.4 /100 | #97 | Exceptional 41.6% |
| Immigrants | Ukraine | 98.3 /100 | #98 | Exceptional 41.5% |
| Immigrants | England | 98.1 /100 | #99 | Exceptional 41.4% |