Venezuelan vs Ottawa Bachelor's Degree
COMPARE
Venezuelan
Ottawa
Bachelor's Degree
Bachelor's Degree Comparison
Venezuelans
Ottawa
40.5%
BACHELOR'S DEGREE
94.7/ 100
METRIC RATING
120th/ 347
METRIC RANK
31.1%
BACHELOR'S DEGREE
0.1/ 100
METRIC RATING
287th/ 347
METRIC RANK
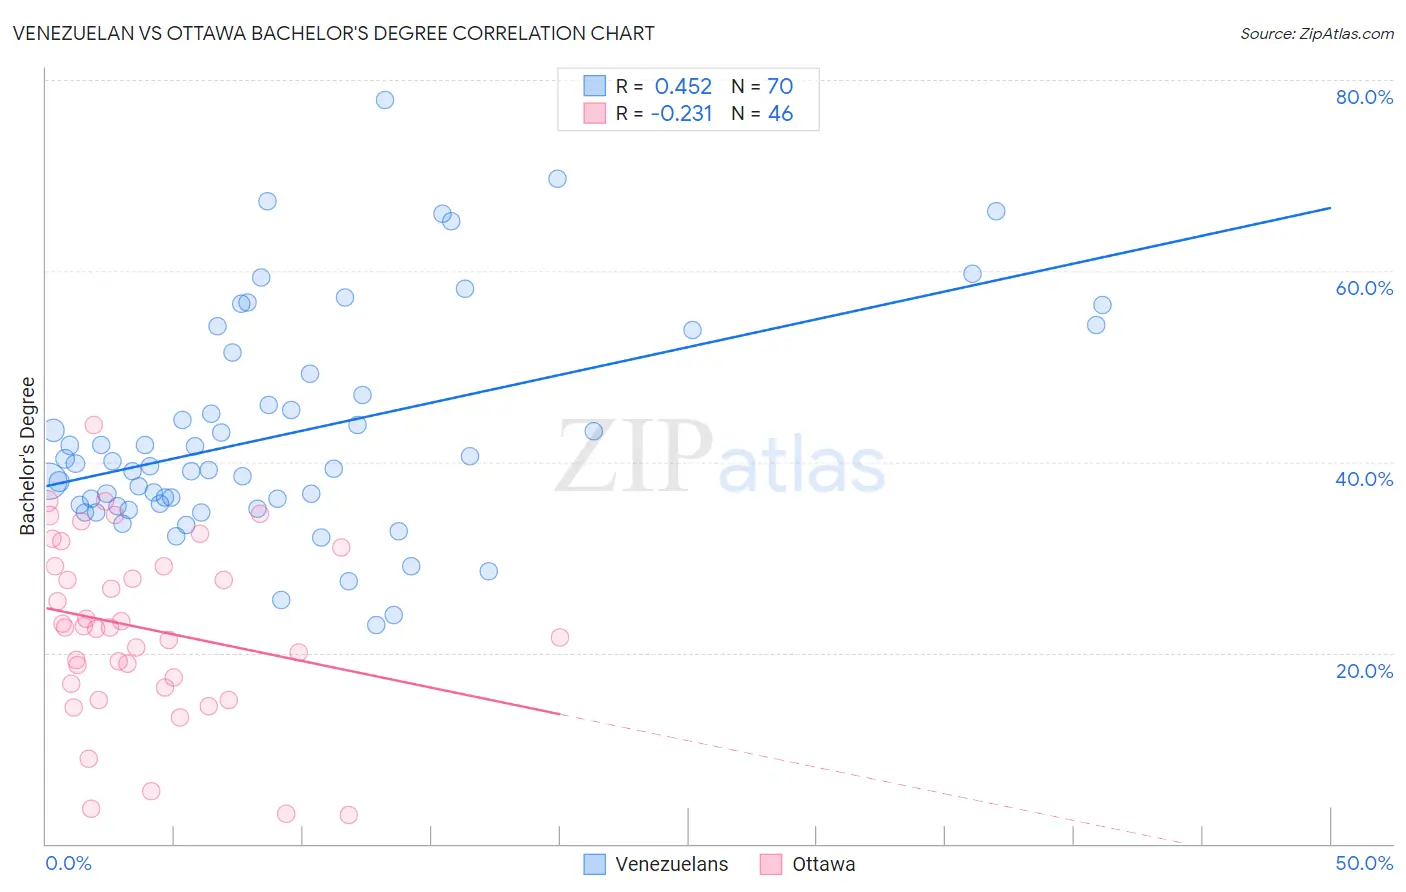
Venezuelan vs Ottawa Bachelor's Degree Correlation Chart
The statistical analysis conducted on geographies consisting of 306,305,141 people shows a moderate positive correlation between the proportion of Venezuelans and percentage of population with at least bachelor's degree education in the United States with a correlation coefficient (R) of 0.452 and weighted average of 40.5%. Similarly, the statistical analysis conducted on geographies consisting of 49,955,025 people shows a weak negative correlation between the proportion of Ottawa and percentage of population with at least bachelor's degree education in the United States with a correlation coefficient (R) of -0.231 and weighted average of 31.1%, a difference of 30.1%.
Bachelor's Degree Correlation Summary
| Measurement | Venezuelan | Ottawa |
| Minimum | 22.9% | 3.0% |
| Maximum | 77.9% | 43.8% |
| Range | 55.1% | 40.8% |
| Mean | 43.1% | 22.6% |
| Median | 39.7% | 22.6% |
| Interquartile 25% (IQ1) | 35.5% | 16.7% |
| Interquartile 75% (IQ3) | 49.3% | 29.1% |
| Interquartile Range (IQR) | 13.8% | 12.4% |
| Standard Deviation (Sample) | 11.7% | 9.4% |
| Standard Deviation (Population) | 11.6% | 9.3% |
Similar Demographics by Bachelor's Degree
Demographics Similar to Venezuelans by Bachelor's Degree
In terms of bachelor's degree, the demographic groups most similar to Venezuelans are Moroccan (40.5%, a difference of 0.050%), Immigrants from Syria (40.5%, a difference of 0.070%), Immigrants from Albania (40.4%, a difference of 0.15%), Lebanese (40.4%, a difference of 0.17%), and Immigrants from Eritrea (40.4%, a difference of 0.17%).
| Demographics | Rating | Rank | Bachelor's Degree |
| Brazilians | 96.3 /100 | #113 | Exceptional 40.8% |
| Afghans | 96.2 /100 | #114 | Exceptional 40.8% |
| Palestinians | 95.8 /100 | #115 | Exceptional 40.7% |
| Immigrants | Uganda | 95.7 /100 | #116 | Exceptional 40.7% |
| Austrians | 95.5 /100 | #117 | Exceptional 40.6% |
| Croatians | 95.5 /100 | #118 | Exceptional 40.6% |
| Immigrants | Syria | 94.9 /100 | #119 | Exceptional 40.5% |
| Venezuelans | 94.7 /100 | #120 | Exceptional 40.5% |
| Moroccans | 94.6 /100 | #121 | Exceptional 40.5% |
| Immigrants | Albania | 94.4 /100 | #122 | Exceptional 40.4% |
| Lebanese | 94.3 /100 | #123 | Exceptional 40.4% |
| Immigrants | Eritrea | 94.3 /100 | #124 | Exceptional 40.4% |
| British | 94.2 /100 | #125 | Exceptional 40.4% |
| Immigrants | Eastern Africa | 94.1 /100 | #126 | Exceptional 40.4% |
| Immigrants | Jordan | 93.4 /100 | #127 | Exceptional 40.3% |
Demographics Similar to Ottawa by Bachelor's Degree
In terms of bachelor's degree, the demographic groups most similar to Ottawa are Guatemalan (31.0%, a difference of 0.36%), Puerto Rican (31.0%, a difference of 0.50%), Immigrants from Honduras (30.9%, a difference of 0.54%), Black/African American (30.9%, a difference of 0.58%), and Immigrants from El Salvador (31.3%, a difference of 0.62%).
| Demographics | Rating | Rank | Bachelor's Degree |
| Immigrants | Laos | 0.1 /100 | #280 | Tragic 31.6% |
| Blackfeet | 0.1 /100 | #281 | Tragic 31.5% |
| Immigrants | Caribbean | 0.1 /100 | #282 | Tragic 31.4% |
| Hondurans | 0.1 /100 | #283 | Tragic 31.3% |
| Haitians | 0.1 /100 | #284 | Tragic 31.3% |
| Aleuts | 0.1 /100 | #285 | Tragic 31.3% |
| Immigrants | El Salvador | 0.1 /100 | #286 | Tragic 31.3% |
| Ottawa | 0.1 /100 | #287 | Tragic 31.1% |
| Guatemalans | 0.1 /100 | #288 | Tragic 31.0% |
| Puerto Ricans | 0.1 /100 | #289 | Tragic 31.0% |
| Immigrants | Honduras | 0.1 /100 | #290 | Tragic 30.9% |
| Blacks/African Americans | 0.1 /100 | #291 | Tragic 30.9% |
| Ute | 0.1 /100 | #292 | Tragic 30.9% |
| Cape Verdeans | 0.1 /100 | #293 | Tragic 30.9% |
| Immigrants | Guatemala | 0.0 /100 | #294 | Tragic 30.8% |