Ute vs Immigrants from Kenya Master's Degree
COMPARE
Ute
Immigrants from Kenya
Master's Degree
Master's Degree Comparison
Ute
Immigrants from Kenya
11.7%
MASTER'S DEGREE
0.1/ 100
METRIC RATING
290th/ 347
METRIC RANK
15.3%
MASTER'S DEGREE
66.6/ 100
METRIC RATING
165th/ 347
METRIC RANK
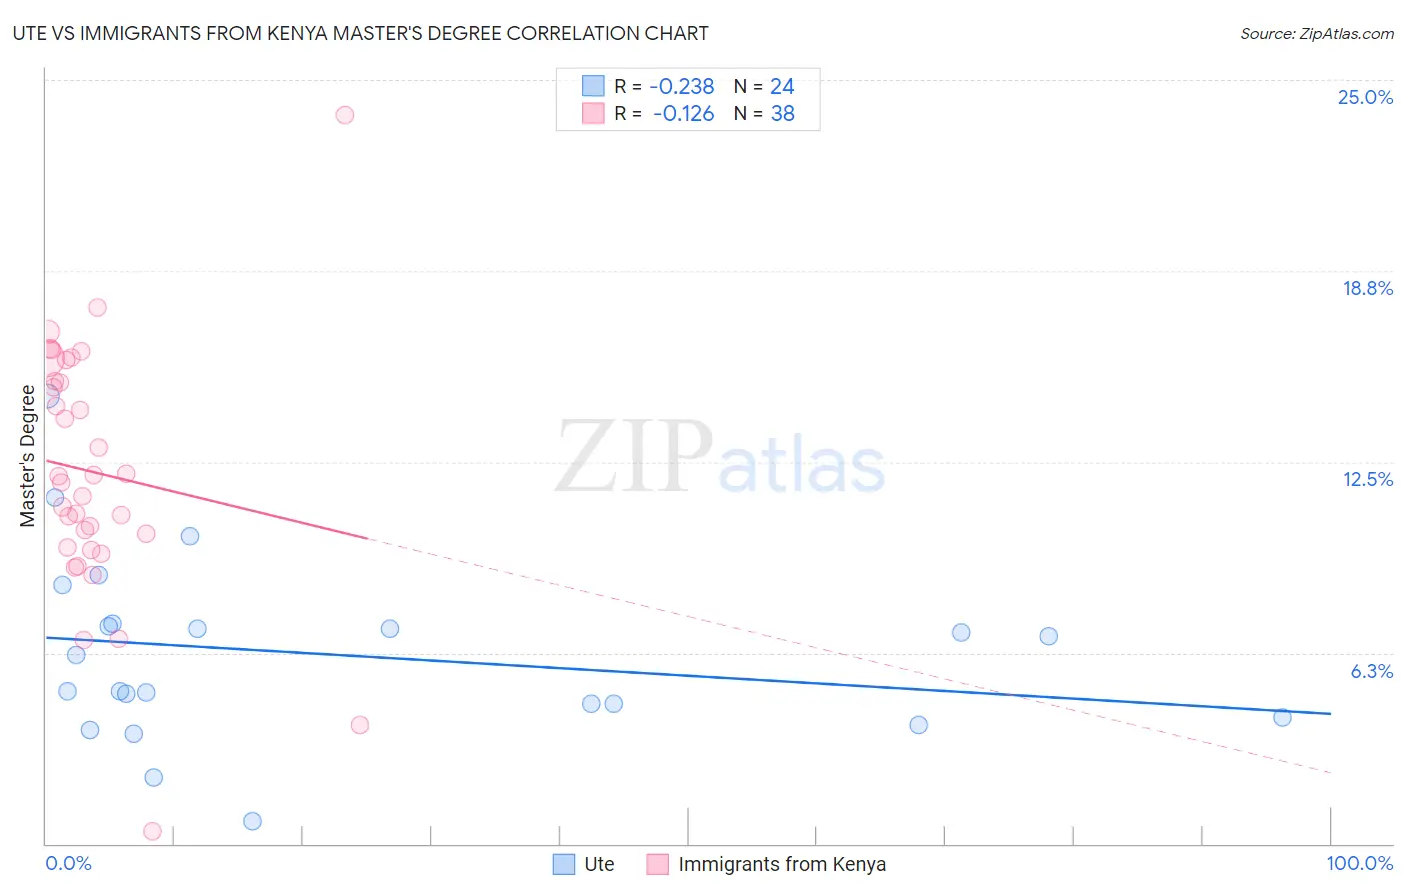
Ute vs Immigrants from Kenya Master's Degree Correlation Chart
The statistical analysis conducted on geographies consisting of 55,657,479 people shows a weak negative correlation between the proportion of Ute and percentage of population with at least master's degree education in the United States with a correlation coefficient (R) of -0.238 and weighted average of 11.7%. Similarly, the statistical analysis conducted on geographies consisting of 218,048,721 people shows a poor negative correlation between the proportion of Immigrants from Kenya and percentage of population with at least master's degree education in the United States with a correlation coefficient (R) of -0.126 and weighted average of 15.3%, a difference of 30.1%.
Master's Degree Correlation Summary
| Measurement | Ute | Immigrants from Kenya |
| Minimum | 0.74% | 0.40% |
| Maximum | 14.6% | 23.9% |
| Range | 13.9% | 23.5% |
| Mean | 6.2% | 12.2% |
| Median | 5.6% | 11.9% |
| Interquartile 25% (IQ1) | 4.4% | 9.7% |
| Interquartile 75% (IQ3) | 7.2% | 15.2% |
| Interquartile Range (IQR) | 2.8% | 5.5% |
| Standard Deviation (Sample) | 3.0% | 4.2% |
| Standard Deviation (Population) | 2.9% | 4.1% |
Similar Demographics by Master's Degree
Demographics Similar to Ute by Master's Degree
In terms of master's degree, the demographic groups most similar to Ute are Guatemalan (11.7%, a difference of 0.24%), Immigrants from Honduras (11.8%, a difference of 0.32%), Immigrants from Haiti (11.8%, a difference of 0.49%), Colville (11.6%, a difference of 0.67%), and Aleut (11.8%, a difference of 0.69%).
| Demographics | Rating | Rank | Master's Degree |
| Hondurans | 0.2 /100 | #283 | Tragic 11.9% |
| Ottawa | 0.2 /100 | #284 | Tragic 11.9% |
| Immigrants | Nicaragua | 0.2 /100 | #285 | Tragic 11.8% |
| Aleuts | 0.1 /100 | #286 | Tragic 11.8% |
| Immigrants | Haiti | 0.1 /100 | #287 | Tragic 11.8% |
| Immigrants | Honduras | 0.1 /100 | #288 | Tragic 11.8% |
| Guatemalans | 0.1 /100 | #289 | Tragic 11.7% |
| Ute | 0.1 /100 | #290 | Tragic 11.7% |
| Colville | 0.1 /100 | #291 | Tragic 11.6% |
| Immigrants | Guatemala | 0.1 /100 | #292 | Tragic 11.6% |
| Alaska Natives | 0.1 /100 | #293 | Tragic 11.6% |
| Hawaiians | 0.1 /100 | #294 | Tragic 11.6% |
| Marshallese | 0.1 /100 | #295 | Tragic 11.6% |
| Alaskan Athabascans | 0.1 /100 | #296 | Tragic 11.6% |
| Immigrants | Yemen | 0.1 /100 | #297 | Tragic 11.6% |
Demographics Similar to Immigrants from Kenya by Master's Degree
In terms of master's degree, the demographic groups most similar to Immigrants from Kenya are Colombian (15.3%, a difference of 0.040%), Uruguayan (15.3%, a difference of 0.070%), Swedish (15.2%, a difference of 0.070%), Senegalese (15.2%, a difference of 0.15%), and Peruvian (15.3%, a difference of 0.29%).
| Demographics | Rating | Rank | Master's Degree |
| Immigrants | Poland | 71.5 /100 | #158 | Good 15.4% |
| Luxembourgers | 71.0 /100 | #159 | Good 15.3% |
| Kenyans | 70.3 /100 | #160 | Good 15.3% |
| Sudanese | 68.7 /100 | #161 | Good 15.3% |
| Peruvians | 68.7 /100 | #162 | Good 15.3% |
| Uruguayans | 67.1 /100 | #163 | Good 15.3% |
| Colombians | 66.9 /100 | #164 | Good 15.3% |
| Immigrants | Kenya | 66.6 /100 | #165 | Good 15.3% |
| Swedes | 66.1 /100 | #166 | Good 15.2% |
| Senegalese | 65.6 /100 | #167 | Good 15.2% |
| Immigrants | North Macedonia | 64.5 /100 | #168 | Good 15.2% |
| Scottish | 62.7 /100 | #169 | Good 15.2% |
| Irish | 56.3 /100 | #170 | Average 15.0% |
| Immigrants | Ghana | 53.6 /100 | #171 | Average 15.0% |
| Immigrants | Uruguay | 52.8 /100 | #172 | Average 15.0% |