Immigrants from Albania vs Immigrants from Kenya Master's Degree
COMPARE
Immigrants from Albania
Immigrants from Kenya
Master's Degree
Master's Degree Comparison
Immigrants from Albania
Immigrants from Kenya
16.8%
MASTER'S DEGREE
98.1/ 100
METRIC RATING
106th/ 347
METRIC RANK
15.3%
MASTER'S DEGREE
66.6/ 100
METRIC RATING
165th/ 347
METRIC RANK
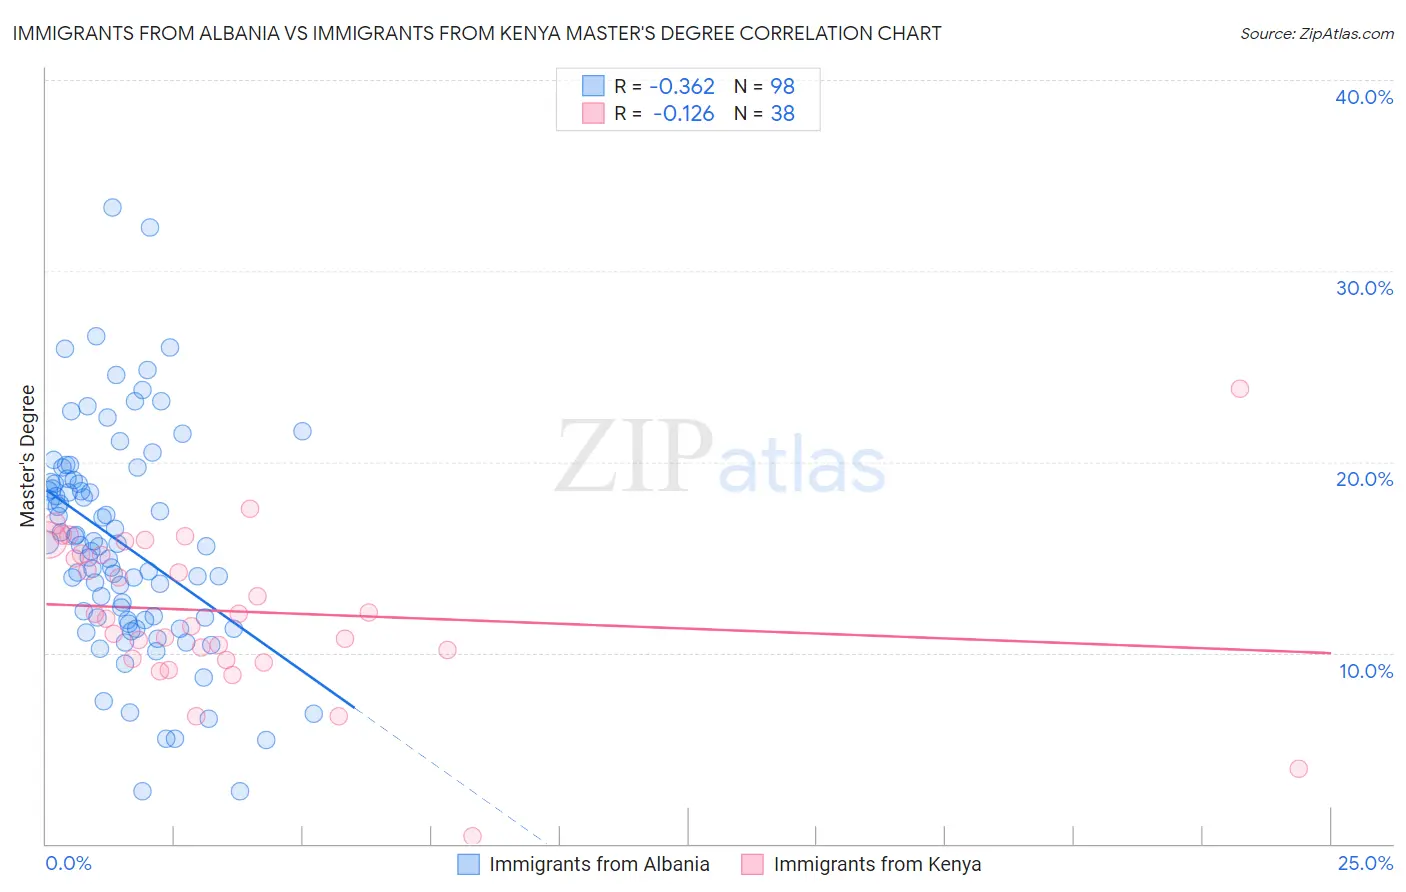
Immigrants from Albania vs Immigrants from Kenya Master's Degree Correlation Chart
The statistical analysis conducted on geographies consisting of 119,391,185 people shows a mild negative correlation between the proportion of Immigrants from Albania and percentage of population with at least master's degree education in the United States with a correlation coefficient (R) of -0.362 and weighted average of 16.8%. Similarly, the statistical analysis conducted on geographies consisting of 218,048,721 people shows a poor negative correlation between the proportion of Immigrants from Kenya and percentage of population with at least master's degree education in the United States with a correlation coefficient (R) of -0.126 and weighted average of 15.3%, a difference of 10.2%.
Master's Degree Correlation Summary
| Measurement | Immigrants from Albania | Immigrants from Kenya |
| Minimum | 2.7% | 0.40% |
| Maximum | 33.3% | 23.9% |
| Range | 30.6% | 23.5% |
| Mean | 15.7% | 12.2% |
| Median | 15.6% | 11.9% |
| Interquartile 25% (IQ1) | 11.7% | 9.7% |
| Interquartile 75% (IQ3) | 18.9% | 15.2% |
| Interquartile Range (IQR) | 7.1% | 5.5% |
| Standard Deviation (Sample) | 5.8% | 4.2% |
| Standard Deviation (Population) | 5.7% | 4.1% |
Similar Demographics by Master's Degree
Demographics Similar to Immigrants from Albania by Master's Degree
In terms of master's degree, the demographic groups most similar to Immigrants from Albania are Armenian (16.8%, a difference of 0.090%), Sierra Leonean (16.8%, a difference of 0.12%), Moroccan (16.8%, a difference of 0.14%), Immigrants from Chile (16.8%, a difference of 0.17%), and Syrian (16.8%, a difference of 0.28%).
| Demographics | Rating | Rank | Master's Degree |
| Laotians | 98.8 /100 | #99 | Exceptional 17.0% |
| Albanians | 98.7 /100 | #100 | Exceptional 17.0% |
| Immigrants | Nepal | 98.6 /100 | #101 | Exceptional 17.0% |
| Chileans | 98.6 /100 | #102 | Exceptional 16.9% |
| Alsatians | 98.4 /100 | #103 | Exceptional 16.9% |
| Ukrainians | 98.3 /100 | #104 | Exceptional 16.9% |
| Syrians | 98.3 /100 | #105 | Exceptional 16.8% |
| Immigrants | Albania | 98.1 /100 | #106 | Exceptional 16.8% |
| Armenians | 98.0 /100 | #107 | Exceptional 16.8% |
| Sierra Leoneans | 98.0 /100 | #108 | Exceptional 16.8% |
| Moroccans | 98.0 /100 | #109 | Exceptional 16.8% |
| Immigrants | Chile | 98.0 /100 | #110 | Exceptional 16.8% |
| Austrians | 97.8 /100 | #111 | Exceptional 16.7% |
| Macedonians | 97.7 /100 | #112 | Exceptional 16.7% |
| Arabs | 97.7 /100 | #113 | Exceptional 16.7% |
Demographics Similar to Immigrants from Kenya by Master's Degree
In terms of master's degree, the demographic groups most similar to Immigrants from Kenya are Colombian (15.3%, a difference of 0.040%), Uruguayan (15.3%, a difference of 0.070%), Swedish (15.2%, a difference of 0.070%), Senegalese (15.2%, a difference of 0.15%), and Peruvian (15.3%, a difference of 0.29%).
| Demographics | Rating | Rank | Master's Degree |
| Immigrants | Poland | 71.5 /100 | #158 | Good 15.4% |
| Luxembourgers | 71.0 /100 | #159 | Good 15.3% |
| Kenyans | 70.3 /100 | #160 | Good 15.3% |
| Sudanese | 68.7 /100 | #161 | Good 15.3% |
| Peruvians | 68.7 /100 | #162 | Good 15.3% |
| Uruguayans | 67.1 /100 | #163 | Good 15.3% |
| Colombians | 66.9 /100 | #164 | Good 15.3% |
| Immigrants | Kenya | 66.6 /100 | #165 | Good 15.3% |
| Swedes | 66.1 /100 | #166 | Good 15.2% |
| Senegalese | 65.6 /100 | #167 | Good 15.2% |
| Immigrants | North Macedonia | 64.5 /100 | #168 | Good 15.2% |
| Scottish | 62.7 /100 | #169 | Good 15.2% |
| Irish | 56.3 /100 | #170 | Average 15.0% |
| Immigrants | Ghana | 53.6 /100 | #171 | Average 15.0% |
| Immigrants | Uruguay | 52.8 /100 | #172 | Average 15.0% |