Ute vs Immigrants from Thailand Master's Degree
COMPARE
Ute
Immigrants from Thailand
Master's Degree
Master's Degree Comparison
Ute
Immigrants from Thailand
11.7%
MASTER'S DEGREE
0.1/ 100
METRIC RATING
290th/ 347
METRIC RANK
14.2%
MASTER'S DEGREE
17.0/ 100
METRIC RATING
213th/ 347
METRIC RANK
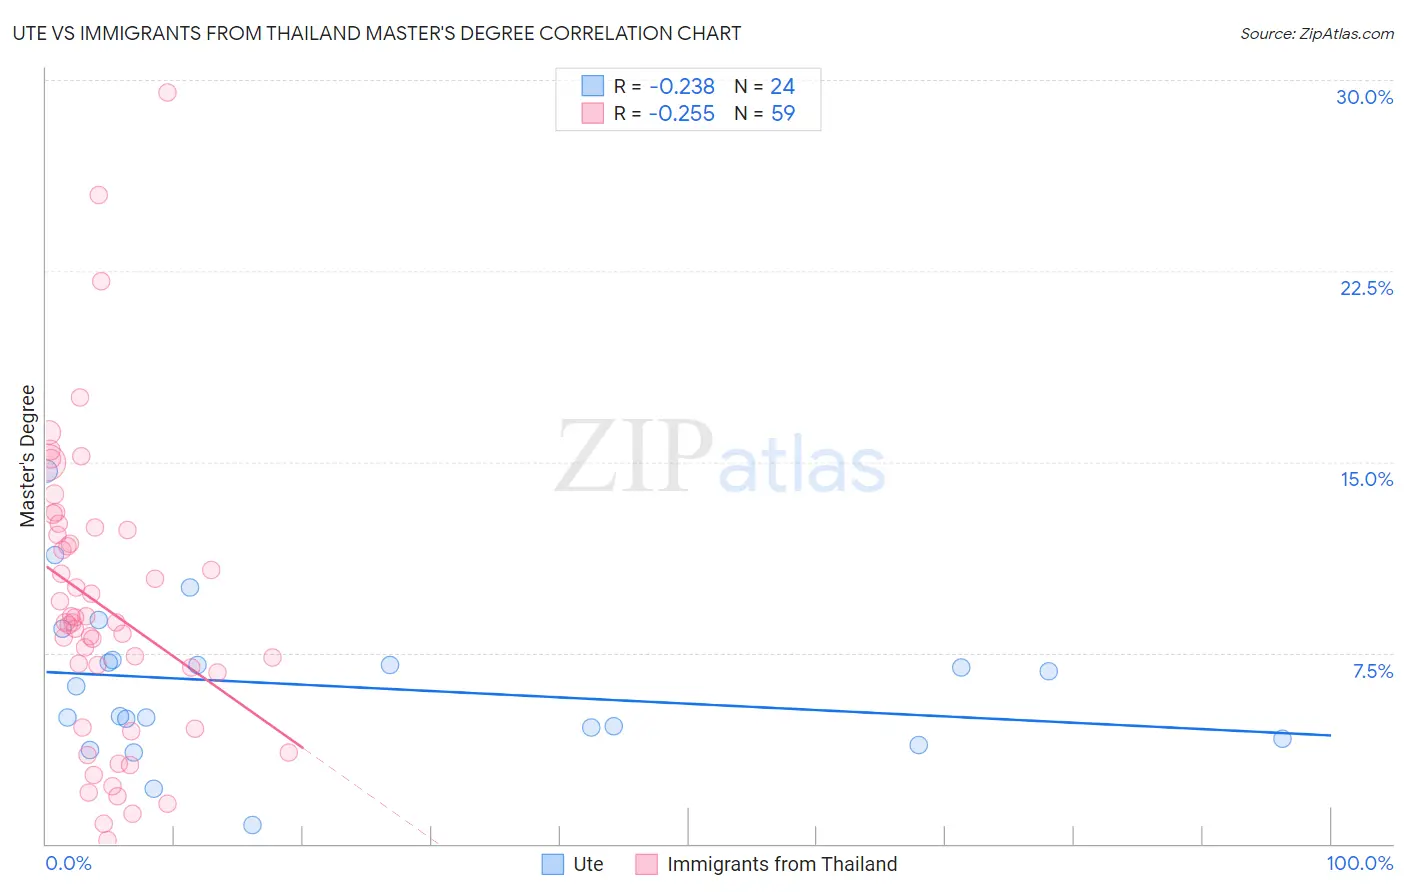
Ute vs Immigrants from Thailand Master's Degree Correlation Chart
The statistical analysis conducted on geographies consisting of 55,657,479 people shows a weak negative correlation between the proportion of Ute and percentage of population with at least master's degree education in the United States with a correlation coefficient (R) of -0.238 and weighted average of 11.7%. Similarly, the statistical analysis conducted on geographies consisting of 316,948,216 people shows a weak negative correlation between the proportion of Immigrants from Thailand and percentage of population with at least master's degree education in the United States with a correlation coefficient (R) of -0.255 and weighted average of 14.2%, a difference of 20.9%.
Master's Degree Correlation Summary
| Measurement | Ute | Immigrants from Thailand |
| Minimum | 0.74% | 0.16% |
| Maximum | 14.6% | 29.5% |
| Range | 13.9% | 29.4% |
| Mean | 6.2% | 9.3% |
| Median | 5.6% | 8.7% |
| Interquartile 25% (IQ1) | 4.4% | 4.5% |
| Interquartile 75% (IQ3) | 7.2% | 12.3% |
| Interquartile Range (IQR) | 2.8% | 7.8% |
| Standard Deviation (Sample) | 3.0% | 5.8% |
| Standard Deviation (Population) | 2.9% | 5.7% |
Similar Demographics by Master's Degree
Demographics Similar to Ute by Master's Degree
In terms of master's degree, the demographic groups most similar to Ute are Guatemalan (11.7%, a difference of 0.24%), Immigrants from Honduras (11.8%, a difference of 0.32%), Immigrants from Haiti (11.8%, a difference of 0.49%), Colville (11.6%, a difference of 0.67%), and Aleut (11.8%, a difference of 0.69%).
| Demographics | Rating | Rank | Master's Degree |
| Hondurans | 0.2 /100 | #283 | Tragic 11.9% |
| Ottawa | 0.2 /100 | #284 | Tragic 11.9% |
| Immigrants | Nicaragua | 0.2 /100 | #285 | Tragic 11.8% |
| Aleuts | 0.1 /100 | #286 | Tragic 11.8% |
| Immigrants | Haiti | 0.1 /100 | #287 | Tragic 11.8% |
| Immigrants | Honduras | 0.1 /100 | #288 | Tragic 11.8% |
| Guatemalans | 0.1 /100 | #289 | Tragic 11.7% |
| Ute | 0.1 /100 | #290 | Tragic 11.7% |
| Colville | 0.1 /100 | #291 | Tragic 11.6% |
| Immigrants | Guatemala | 0.1 /100 | #292 | Tragic 11.6% |
| Alaska Natives | 0.1 /100 | #293 | Tragic 11.6% |
| Hawaiians | 0.1 /100 | #294 | Tragic 11.6% |
| Marshallese | 0.1 /100 | #295 | Tragic 11.6% |
| Alaskan Athabascans | 0.1 /100 | #296 | Tragic 11.6% |
| Immigrants | Yemen | 0.1 /100 | #297 | Tragic 11.6% |
Demographics Similar to Immigrants from Thailand by Master's Degree
In terms of master's degree, the demographic groups most similar to Immigrants from Thailand are Finnish (14.2%, a difference of 0.010%), Spanish (14.2%, a difference of 0.19%), Immigrants from Vietnam (14.1%, a difference of 0.22%), Somali (14.2%, a difference of 0.24%), and Immigrants from Somalia (14.1%, a difference of 0.29%).
| Demographics | Rating | Rank | Master's Degree |
| Scandinavians | 23.3 /100 | #206 | Fair 14.4% |
| Immigrants | Bosnia and Herzegovina | 22.0 /100 | #207 | Fair 14.3% |
| Immigrants | Barbados | 20.5 /100 | #208 | Fair 14.3% |
| Immigrants | Panama | 20.0 /100 | #209 | Fair 14.3% |
| Sub-Saharan Africans | 19.4 /100 | #210 | Poor 14.2% |
| Somalis | 18.0 /100 | #211 | Poor 14.2% |
| Spanish | 17.8 /100 | #212 | Poor 14.2% |
| Immigrants | Thailand | 17.0 /100 | #213 | Poor 14.2% |
| Finns | 16.9 /100 | #214 | Poor 14.2% |
| Immigrants | Vietnam | 16.1 /100 | #215 | Poor 14.1% |
| Immigrants | Somalia | 15.8 /100 | #216 | Poor 14.1% |
| Immigrants | Trinidad and Tobago | 15.8 /100 | #217 | Poor 14.1% |
| French Canadians | 14.9 /100 | #218 | Poor 14.1% |
| Norwegians | 13.6 /100 | #219 | Poor 14.0% |
| Germans | 13.1 /100 | #220 | Poor 14.0% |