Danish vs Immigrants from Kenya Master's Degree
COMPARE
Danish
Immigrants from Kenya
Master's Degree
Master's Degree Comparison
Danes
Immigrants from Kenya
14.5%
MASTER'S DEGREE
31.3/ 100
METRIC RATING
195th/ 347
METRIC RANK
15.3%
MASTER'S DEGREE
66.6/ 100
METRIC RATING
165th/ 347
METRIC RANK
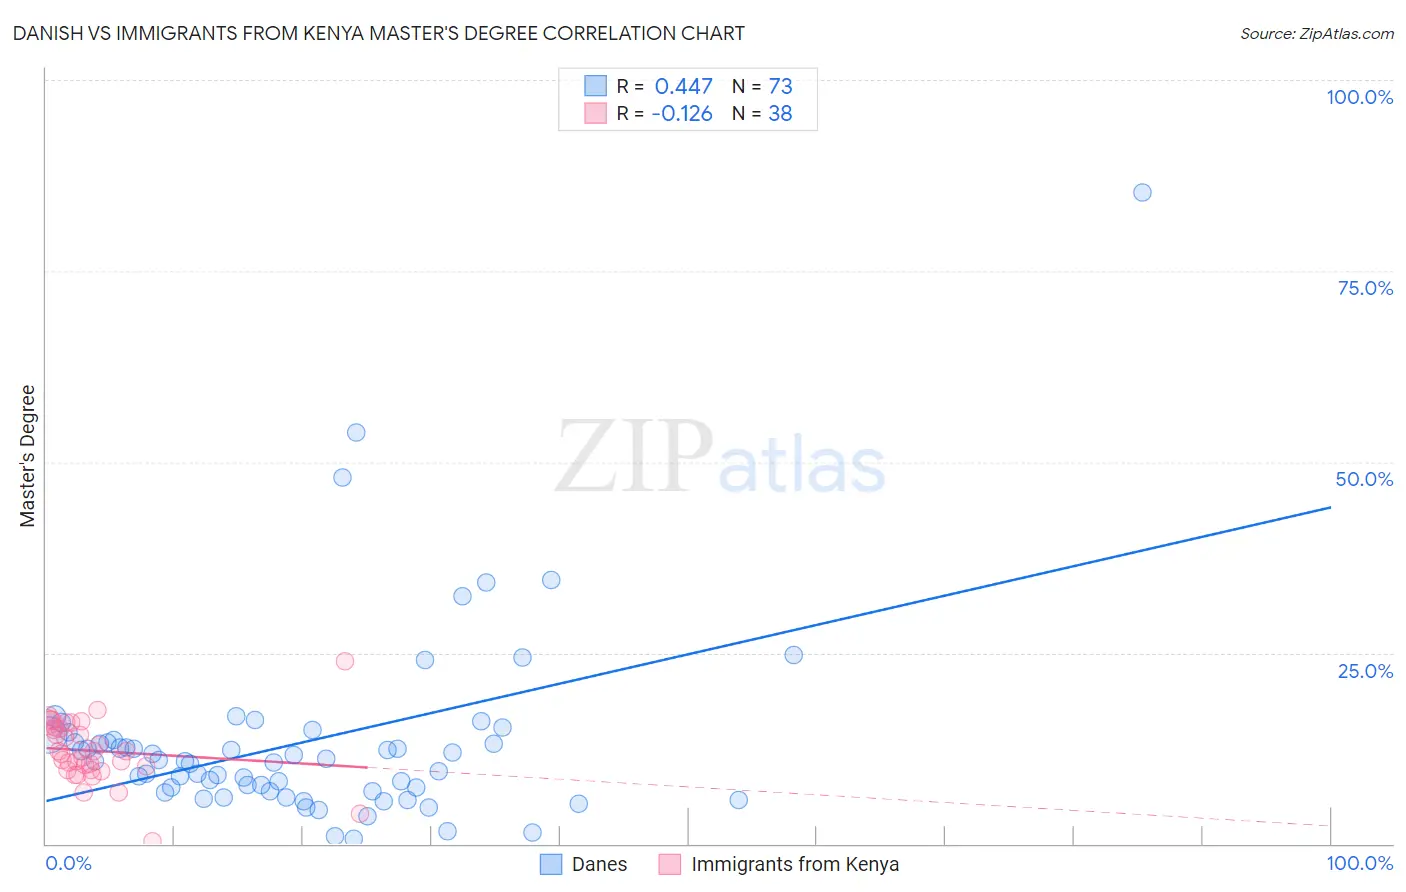
Danish vs Immigrants from Kenya Master's Degree Correlation Chart
The statistical analysis conducted on geographies consisting of 473,923,988 people shows a moderate positive correlation between the proportion of Danes and percentage of population with at least master's degree education in the United States with a correlation coefficient (R) of 0.447 and weighted average of 14.5%. Similarly, the statistical analysis conducted on geographies consisting of 218,048,721 people shows a poor negative correlation between the proportion of Immigrants from Kenya and percentage of population with at least master's degree education in the United States with a correlation coefficient (R) of -0.126 and weighted average of 15.3%, a difference of 4.9%.
Master's Degree Correlation Summary
| Measurement | Danish | Immigrants from Kenya |
| Minimum | 0.60% | 0.40% |
| Maximum | 85.3% | 23.9% |
| Range | 84.7% | 23.5% |
| Mean | 13.3% | 12.2% |
| Median | 10.8% | 11.9% |
| Interquartile 25% (IQ1) | 6.8% | 9.7% |
| Interquartile 75% (IQ3) | 13.9% | 15.2% |
| Interquartile Range (IQR) | 7.0% | 5.5% |
| Standard Deviation (Sample) | 12.7% | 4.2% |
| Standard Deviation (Population) | 12.6% | 4.1% |
Similar Demographics by Master's Degree
Demographics Similar to Danes by Master's Degree
In terms of master's degree, the demographic groups most similar to Danes are Chinese (14.6%, a difference of 0.18%), Immigrants from Nigeria (14.6%, a difference of 0.22%), Czechoslovakian (14.5%, a difference of 0.22%), Immigrants from Middle Africa (14.6%, a difference of 0.35%), and Welsh (14.6%, a difference of 0.44%).
| Demographics | Rating | Rank | Master's Degree |
| Immigrants | Costa Rica | 36.2 /100 | #188 | Fair 14.7% |
| Immigrants | Immigrants | 36.0 /100 | #189 | Fair 14.6% |
| Spaniards | 35.8 /100 | #190 | Fair 14.6% |
| Welsh | 34.2 /100 | #191 | Fair 14.6% |
| Immigrants | Middle Africa | 33.6 /100 | #192 | Fair 14.6% |
| Immigrants | Nigeria | 32.7 /100 | #193 | Fair 14.6% |
| Chinese | 32.5 /100 | #194 | Fair 14.6% |
| Danes | 31.3 /100 | #195 | Fair 14.5% |
| Czechoslovakians | 29.9 /100 | #196 | Fair 14.5% |
| Belgians | 28.0 /100 | #197 | Fair 14.5% |
| West Indians | 27.4 /100 | #198 | Fair 14.5% |
| Immigrants | Armenia | 27.2 /100 | #199 | Fair 14.5% |
| Panamanians | 25.1 /100 | #200 | Fair 14.4% |
| Scotch-Irish | 25.0 /100 | #201 | Fair 14.4% |
| Immigrants | Western Africa | 24.9 /100 | #202 | Fair 14.4% |
Demographics Similar to Immigrants from Kenya by Master's Degree
In terms of master's degree, the demographic groups most similar to Immigrants from Kenya are Colombian (15.3%, a difference of 0.040%), Uruguayan (15.3%, a difference of 0.070%), Swedish (15.2%, a difference of 0.070%), Senegalese (15.2%, a difference of 0.15%), and Peruvian (15.3%, a difference of 0.29%).
| Demographics | Rating | Rank | Master's Degree |
| Immigrants | Poland | 71.5 /100 | #158 | Good 15.4% |
| Luxembourgers | 71.0 /100 | #159 | Good 15.3% |
| Kenyans | 70.3 /100 | #160 | Good 15.3% |
| Sudanese | 68.7 /100 | #161 | Good 15.3% |
| Peruvians | 68.7 /100 | #162 | Good 15.3% |
| Uruguayans | 67.1 /100 | #163 | Good 15.3% |
| Colombians | 66.9 /100 | #164 | Good 15.3% |
| Immigrants | Kenya | 66.6 /100 | #165 | Good 15.3% |
| Swedes | 66.1 /100 | #166 | Good 15.2% |
| Senegalese | 65.6 /100 | #167 | Good 15.2% |
| Immigrants | North Macedonia | 64.5 /100 | #168 | Good 15.2% |
| Scottish | 62.7 /100 | #169 | Good 15.2% |
| Irish | 56.3 /100 | #170 | Average 15.0% |
| Immigrants | Ghana | 53.6 /100 | #171 | Average 15.0% |
| Immigrants | Uruguay | 52.8 /100 | #172 | Average 15.0% |