Immigrants from Portugal vs Immigrants from Kenya Master's Degree
COMPARE
Immigrants from Portugal
Immigrants from Kenya
Master's Degree
Master's Degree Comparison
Immigrants from Portugal
Immigrants from Kenya
12.6%
MASTER'S DEGREE
0.8/ 100
METRIC RATING
256th/ 347
METRIC RANK
15.3%
MASTER'S DEGREE
66.6/ 100
METRIC RATING
165th/ 347
METRIC RANK
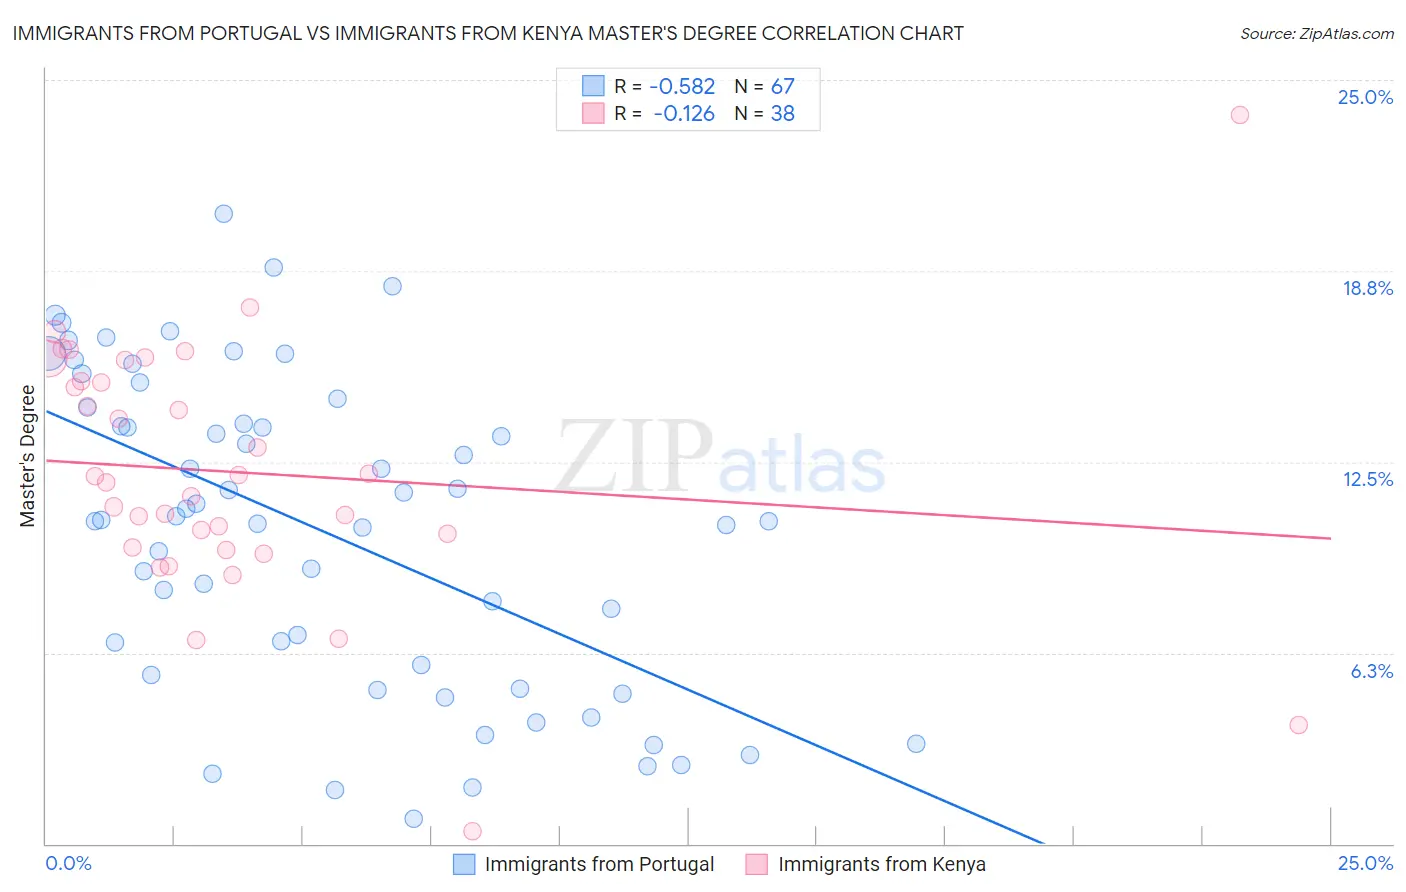
Immigrants from Portugal vs Immigrants from Kenya Master's Degree Correlation Chart
The statistical analysis conducted on geographies consisting of 174,778,978 people shows a substantial negative correlation between the proportion of Immigrants from Portugal and percentage of population with at least master's degree education in the United States with a correlation coefficient (R) of -0.582 and weighted average of 12.6%. Similarly, the statistical analysis conducted on geographies consisting of 218,048,721 people shows a poor negative correlation between the proportion of Immigrants from Kenya and percentage of population with at least master's degree education in the United States with a correlation coefficient (R) of -0.126 and weighted average of 15.3%, a difference of 20.8%.
Master's Degree Correlation Summary
| Measurement | Immigrants from Portugal | Immigrants from Kenya |
| Minimum | 0.81% | 0.40% |
| Maximum | 20.6% | 23.9% |
| Range | 19.8% | 23.5% |
| Mean | 10.3% | 12.2% |
| Median | 10.6% | 11.9% |
| Interquartile 25% (IQ1) | 5.5% | 9.7% |
| Interquartile 75% (IQ3) | 14.3% | 15.2% |
| Interquartile Range (IQR) | 8.8% | 5.5% |
| Standard Deviation (Sample) | 5.1% | 4.2% |
| Standard Deviation (Population) | 5.1% | 4.1% |
Similar Demographics by Master's Degree
Demographics Similar to Immigrants from Portugal by Master's Degree
In terms of master's degree, the demographic groups most similar to Immigrants from Portugal are Immigrants from Congo (12.6%, a difference of 0.080%), Indonesian (12.6%, a difference of 0.10%), Immigrants from Dominica (12.6%, a difference of 0.14%), Osage (12.6%, a difference of 0.48%), and French American Indian (12.7%, a difference of 0.69%).
| Demographics | Rating | Rank | Master's Degree |
| Cree | 1.3 /100 | #249 | Tragic 12.8% |
| Liberians | 1.3 /100 | #250 | Tragic 12.8% |
| Tlingit-Haida | 1.3 /100 | #251 | Tragic 12.8% |
| French American Indians | 1.0 /100 | #252 | Tragic 12.7% |
| Immigrants | Dominica | 0.8 /100 | #253 | Tragic 12.6% |
| Indonesians | 0.8 /100 | #254 | Tragic 12.6% |
| Immigrants | Congo | 0.8 /100 | #255 | Tragic 12.6% |
| Immigrants | Portugal | 0.8 /100 | #256 | Tragic 12.6% |
| Osage | 0.7 /100 | #257 | Tragic 12.6% |
| Immigrants | Liberia | 0.6 /100 | #258 | Tragic 12.5% |
| Japanese | 0.6 /100 | #259 | Tragic 12.5% |
| Dominicans | 0.6 /100 | #260 | Tragic 12.5% |
| Tongans | 0.6 /100 | #261 | Tragic 12.5% |
| Nicaraguans | 0.6 /100 | #262 | Tragic 12.5% |
| Central American Indians | 0.5 /100 | #263 | Tragic 12.4% |
Demographics Similar to Immigrants from Kenya by Master's Degree
In terms of master's degree, the demographic groups most similar to Immigrants from Kenya are Colombian (15.3%, a difference of 0.040%), Uruguayan (15.3%, a difference of 0.070%), Swedish (15.2%, a difference of 0.070%), Senegalese (15.2%, a difference of 0.15%), and Peruvian (15.3%, a difference of 0.29%).
| Demographics | Rating | Rank | Master's Degree |
| Immigrants | Poland | 71.5 /100 | #158 | Good 15.4% |
| Luxembourgers | 71.0 /100 | #159 | Good 15.3% |
| Kenyans | 70.3 /100 | #160 | Good 15.3% |
| Sudanese | 68.7 /100 | #161 | Good 15.3% |
| Peruvians | 68.7 /100 | #162 | Good 15.3% |
| Uruguayans | 67.1 /100 | #163 | Good 15.3% |
| Colombians | 66.9 /100 | #164 | Good 15.3% |
| Immigrants | Kenya | 66.6 /100 | #165 | Good 15.3% |
| Swedes | 66.1 /100 | #166 | Good 15.2% |
| Senegalese | 65.6 /100 | #167 | Good 15.2% |
| Immigrants | North Macedonia | 64.5 /100 | #168 | Good 15.2% |
| Scottish | 62.7 /100 | #169 | Good 15.2% |
| Irish | 56.3 /100 | #170 | Average 15.0% |
| Immigrants | Ghana | 53.6 /100 | #171 | Average 15.0% |
| Immigrants | Uruguay | 52.8 /100 | #172 | Average 15.0% |