Immigrants from St. Vincent and the Grenadines vs Fijian Master's Degree
COMPARE
Immigrants from St. Vincent and the Grenadines
Fijian
Master's Degree
Master's Degree Comparison
Immigrants from St. Vincent and the Grenadines
Fijians
13.9%
MASTER'S DEGREE
11.0/ 100
METRIC RATING
226th/ 347
METRIC RANK
10.3%
MASTER'S DEGREE
0.0/ 100
METRIC RATING
330th/ 347
METRIC RANK
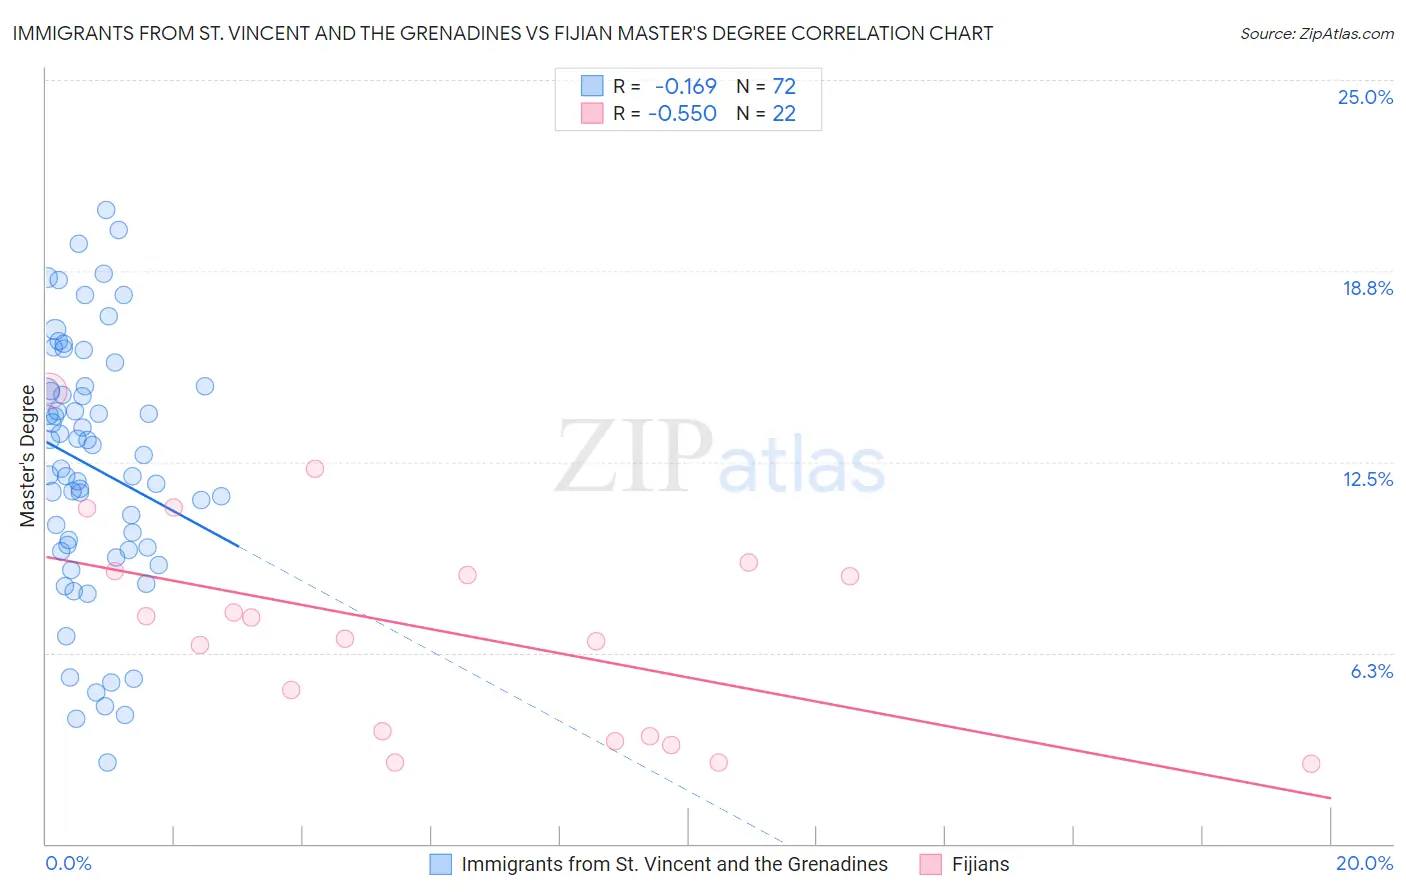
Immigrants from St. Vincent and the Grenadines vs Fijian Master's Degree Correlation Chart
The statistical analysis conducted on geographies consisting of 56,186,980 people shows a poor negative correlation between the proportion of Immigrants from St. Vincent and the Grenadines and percentage of population with at least master's degree education in the United States with a correlation coefficient (R) of -0.169 and weighted average of 13.9%. Similarly, the statistical analysis conducted on geographies consisting of 55,944,571 people shows a substantial negative correlation between the proportion of Fijians and percentage of population with at least master's degree education in the United States with a correlation coefficient (R) of -0.550 and weighted average of 10.3%, a difference of 35.3%.
Master's Degree Correlation Summary
| Measurement | Immigrants from St. Vincent and the Grenadines | Fijian |
| Minimum | 2.6% | 2.6% |
| Maximum | 20.8% | 14.8% |
| Range | 18.1% | 12.2% |
| Mean | 12.3% | 7.0% |
| Median | 12.5% | 7.1% |
| Interquartile 25% (IQ1) | 9.6% | 3.5% |
| Interquartile 75% (IQ3) | 14.9% | 8.9% |
| Interquartile Range (IQR) | 5.3% | 5.4% |
| Standard Deviation (Sample) | 4.2% | 3.4% |
| Standard Deviation (Population) | 4.1% | 3.4% |
Similar Demographics by Master's Degree
Demographics Similar to Immigrants from St. Vincent and the Grenadines by Master's Degree
In terms of master's degree, the demographic groups most similar to Immigrants from St. Vincent and the Grenadines are Portuguese (13.9%, a difference of 0.050%), Immigrants from Grenada (14.0%, a difference of 0.26%), Immigrants from South Eastern Asia (14.0%, a difference of 0.31%), Immigrants from West Indies (13.9%, a difference of 0.44%), and Ecuadorian (14.0%, a difference of 0.51%).
| Demographics | Rating | Rank | Master's Degree |
| Norwegians | 13.6 /100 | #219 | Poor 14.0% |
| Germans | 13.1 /100 | #220 | Poor 14.0% |
| Koreans | 12.7 /100 | #221 | Poor 14.0% |
| Ecuadorians | 12.6 /100 | #222 | Poor 14.0% |
| Immigrants | South Eastern Asia | 11.9 /100 | #223 | Poor 14.0% |
| Immigrants | Grenada | 11.8 /100 | #224 | Poor 14.0% |
| Portuguese | 11.2 /100 | #225 | Poor 13.9% |
| Immigrants | St. Vincent and the Grenadines | 11.0 /100 | #226 | Poor 13.9% |
| Immigrants | West Indies | 9.8 /100 | #227 | Tragic 13.9% |
| Whites/Caucasians | 9.1 /100 | #228 | Tragic 13.8% |
| British West Indians | 8.8 /100 | #229 | Tragic 13.8% |
| Dutch | 8.7 /100 | #230 | Tragic 13.8% |
| Guyanese | 7.6 /100 | #231 | Tragic 13.7% |
| Immigrants | Philippines | 6.0 /100 | #232 | Tragic 13.6% |
| Immigrants | Ecuador | 5.7 /100 | #233 | Tragic 13.6% |
Demographics Similar to Fijians by Master's Degree
In terms of master's degree, the demographic groups most similar to Fijians are Pueblo (10.3%, a difference of 0.16%), Immigrants from the Azores (10.2%, a difference of 0.63%), Menominee (10.2%, a difference of 1.0%), Nepalese (10.5%, a difference of 1.7%), and Bangladeshi (10.5%, a difference of 1.8%).
| Demographics | Rating | Rank | Master's Degree |
| Crow | 0.0 /100 | #323 | Tragic 10.6% |
| Dutch West Indians | 0.0 /100 | #324 | Tragic 10.6% |
| Inupiat | 0.0 /100 | #325 | Tragic 10.5% |
| Creek | 0.0 /100 | #326 | Tragic 10.5% |
| Paiute | 0.0 /100 | #327 | Tragic 10.5% |
| Bangladeshis | 0.0 /100 | #328 | Tragic 10.5% |
| Nepalese | 0.0 /100 | #329 | Tragic 10.5% |
| Fijians | 0.0 /100 | #330 | Tragic 10.3% |
| Pueblo | 0.0 /100 | #331 | Tragic 10.3% |
| Immigrants | Azores | 0.0 /100 | #332 | Tragic 10.2% |
| Menominee | 0.0 /100 | #333 | Tragic 10.2% |
| Arapaho | 0.0 /100 | #334 | Tragic 10.0% |
| Immigrants | Central America | 0.0 /100 | #335 | Tragic 10.0% |
| Natives/Alaskans | 0.0 /100 | #336 | Tragic 9.9% |
| Mexicans | 0.0 /100 | #337 | Tragic 9.7% |