Ute vs Immigrants from Congo 4th Grade
COMPARE
Ute
Immigrants from Congo
4th Grade
4th Grade Comparison
Ute
Immigrants from Congo
97.7%
4TH GRADE
80.6/ 100
METRIC RATING
147th/ 347
METRIC RANK
97.0%
4TH GRADE
0.5/ 100
METRIC RATING
257th/ 347
METRIC RANK
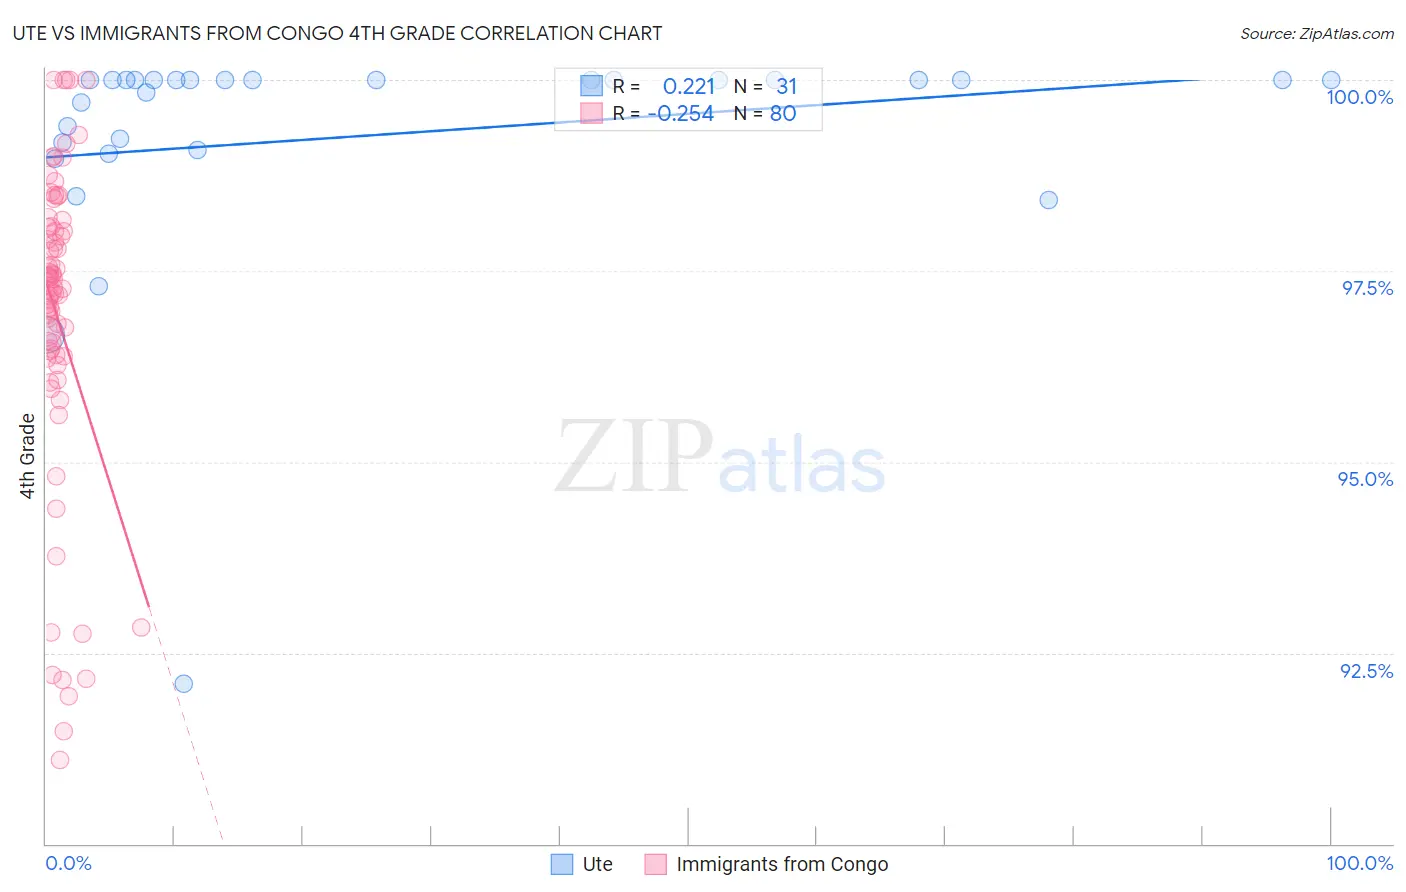
Ute vs Immigrants from Congo 4th Grade Correlation Chart
The statistical analysis conducted on geographies consisting of 55,668,289 people shows a weak positive correlation between the proportion of Ute and percentage of population with at least 4th grade education in the United States with a correlation coefficient (R) of 0.221 and weighted average of 97.7%. Similarly, the statistical analysis conducted on geographies consisting of 92,124,753 people shows a weak negative correlation between the proportion of Immigrants from Congo and percentage of population with at least 4th grade education in the United States with a correlation coefficient (R) of -0.254 and weighted average of 97.0%, a difference of 0.64%.
4th Grade Correlation Summary
| Measurement | Ute | Immigrants from Congo |
| Minimum | 92.1% | 91.1% |
| Maximum | 100.0% | 100.0% |
| Range | 7.9% | 8.9% |
| Mean | 99.3% | 96.9% |
| Median | 100.0% | 97.3% |
| Interquartile 25% (IQ1) | 99.1% | 96.4% |
| Interquartile 75% (IQ3) | 100.0% | 98.1% |
| Interquartile Range (IQR) | 0.92% | 1.7% |
| Standard Deviation (Sample) | 1.6% | 2.1% |
| Standard Deviation (Population) | 1.5% | 2.1% |
Similar Demographics by 4th Grade
Demographics Similar to Ute by 4th Grade
In terms of 4th grade, the demographic groups most similar to Ute are Jordanian (97.7%, a difference of 0.0%), Hopi (97.7%, a difference of 0.0%), Burmese (97.7%, a difference of 0.010%), Spaniard (97.7%, a difference of 0.010%), and Immigrants from Moldova (97.7%, a difference of 0.010%).
| Demographics | Rating | Rank | 4th Grade |
| Filipinos | 84.0 /100 | #140 | Excellent 97.7% |
| Immigrants | Greece | 83.8 /100 | #141 | Excellent 97.7% |
| Immigrants | North Macedonia | 83.3 /100 | #142 | Excellent 97.7% |
| Burmese | 82.8 /100 | #143 | Excellent 97.7% |
| Spaniards | 82.7 /100 | #144 | Excellent 97.7% |
| Immigrants | Moldova | 82.4 /100 | #145 | Excellent 97.7% |
| Jordanians | 81.3 /100 | #146 | Excellent 97.7% |
| Ute | 80.6 /100 | #147 | Excellent 97.7% |
| Hopi | 80.6 /100 | #148 | Excellent 97.7% |
| Soviet Union | 77.8 /100 | #149 | Good 97.6% |
| Immigrants | Israel | 77.7 /100 | #150 | Good 97.6% |
| Alsatians | 77.2 /100 | #151 | Good 97.6% |
| Immigrants | South Central Asia | 76.2 /100 | #152 | Good 97.6% |
| Immigrants | Eastern Europe | 71.3 /100 | #153 | Good 97.6% |
| Immigrants | Russia | 67.0 /100 | #154 | Good 97.6% |
Demographics Similar to Immigrants from Congo by 4th Grade
In terms of 4th grade, the demographic groups most similar to Immigrants from Congo are Immigrants from Colombia (97.0%, a difference of 0.0%), Immigrants from Ethiopia (97.0%, a difference of 0.010%), Immigrants from Sierra Leone (97.0%, a difference of 0.020%), Immigrants from South America (97.0%, a difference of 0.020%), and West Indian (97.0%, a difference of 0.030%).
| Demographics | Rating | Rank | 4th Grade |
| Immigrants | Senegal | 0.9 /100 | #250 | Tragic 97.1% |
| South Americans | 0.8 /100 | #251 | Tragic 97.1% |
| Jamaicans | 0.8 /100 | #252 | Tragic 97.1% |
| Immigrants | Liberia | 0.8 /100 | #253 | Tragic 97.1% |
| Immigrants | Middle Africa | 0.8 /100 | #254 | Tragic 97.1% |
| Peruvians | 0.7 /100 | #255 | Tragic 97.1% |
| Bolivians | 0.7 /100 | #256 | Tragic 97.1% |
| Immigrants | Congo | 0.5 /100 | #257 | Tragic 97.0% |
| Immigrants | Colombia | 0.5 /100 | #258 | Tragic 97.0% |
| Immigrants | Ethiopia | 0.4 /100 | #259 | Tragic 97.0% |
| Immigrants | Sierra Leone | 0.4 /100 | #260 | Tragic 97.0% |
| Immigrants | South America | 0.4 /100 | #261 | Tragic 97.0% |
| West Indians | 0.4 /100 | #262 | Tragic 97.0% |
| Immigrants | Jamaica | 0.3 /100 | #263 | Tragic 97.0% |
| Taiwanese | 0.3 /100 | #264 | Tragic 97.0% |