U.S. Virgin Islander vs Malaysian Nursery School
COMPARE
U.S. Virgin Islander
Malaysian
Nursery School
Nursery School Comparison
U.S. Virgin Islanders
Malaysians
97.7%
NURSERY SCHOOL
2.1/ 100
METRIC RATING
233rd/ 347
METRIC RANK
97.3%
NURSERY SCHOOL
0.0/ 100
METRIC RATING
293rd/ 347
METRIC RANK
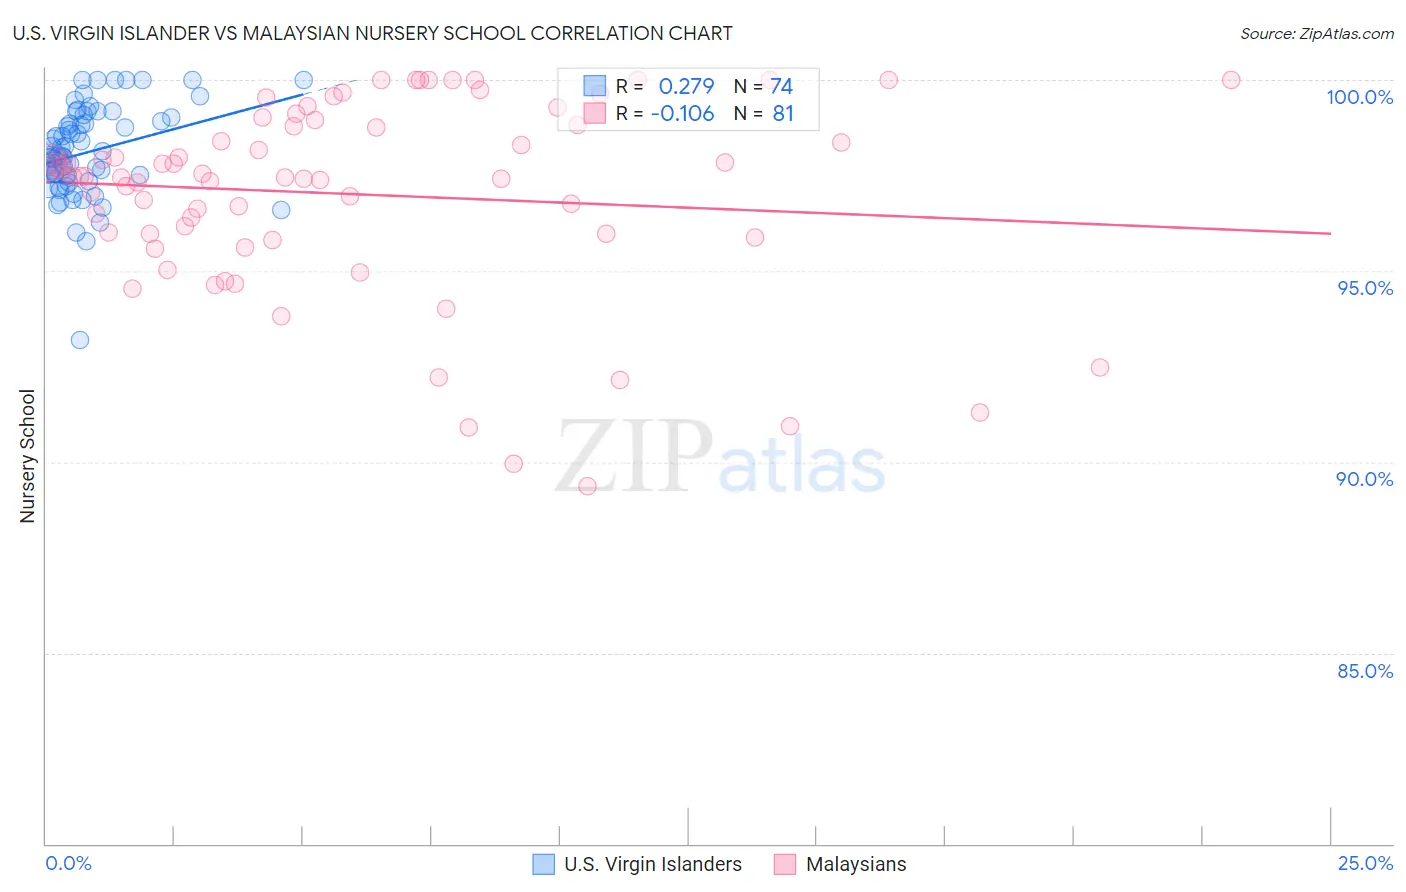
U.S. Virgin Islander vs Malaysian Nursery School Correlation Chart
The statistical analysis conducted on geographies consisting of 87,529,315 people shows a weak positive correlation between the proportion of U.S. Virgin Islanders and percentage of population with at least nursery school education in the United States with a correlation coefficient (R) of 0.279 and weighted average of 97.7%. Similarly, the statistical analysis conducted on geographies consisting of 226,107,000 people shows a poor negative correlation between the proportion of Malaysians and percentage of population with at least nursery school education in the United States with a correlation coefficient (R) of -0.106 and weighted average of 97.3%, a difference of 0.45%.
Nursery School Correlation Summary
| Measurement | U.S. Virgin Islander | Malaysian |
| Minimum | 93.2% | 89.4% |
| Maximum | 100.0% | 100.0% |
| Range | 6.8% | 10.6% |
| Mean | 98.1% | 97.0% |
| Median | 98.0% | 97.5% |
| Interquartile 25% (IQ1) | 97.5% | 95.9% |
| Interquartile 75% (IQ3) | 98.9% | 98.9% |
| Interquartile Range (IQR) | 1.4% | 3.0% |
| Standard Deviation (Sample) | 1.2% | 2.5% |
| Standard Deviation (Population) | 1.2% | 2.5% |
Similar Demographics by Nursery School
Demographics Similar to U.S. Virgin Islanders by Nursery School
In terms of nursery school, the demographic groups most similar to U.S. Virgin Islanders are Colombian (97.7%, a difference of 0.0%), Immigrants from Pakistan (97.7%, a difference of 0.0%), Puerto Rican (97.7%, a difference of 0.010%), Immigrants from Uruguay (97.7%, a difference of 0.010%), and Immigrants from Malaysia (97.7%, a difference of 0.010%).
| Demographics | Rating | Rank | Nursery School |
| Iraqis | 3.5 /100 | #226 | Tragic 97.7% |
| Sub-Saharan Africans | 3.2 /100 | #227 | Tragic 97.7% |
| Sudanese | 3.2 /100 | #228 | Tragic 97.7% |
| Senegalese | 3.2 /100 | #229 | Tragic 97.7% |
| Sierra Leoneans | 2.9 /100 | #230 | Tragic 97.7% |
| Puerto Ricans | 2.6 /100 | #231 | Tragic 97.7% |
| Immigrants | Uruguay | 2.3 /100 | #232 | Tragic 97.7% |
| U.S. Virgin Islanders | 2.1 /100 | #233 | Tragic 97.7% |
| Colombians | 2.1 /100 | #234 | Tragic 97.7% |
| Immigrants | Pakistan | 2.1 /100 | #235 | Tragic 97.7% |
| Immigrants | Malaysia | 1.9 /100 | #236 | Tragic 97.7% |
| Immigrants | Western Asia | 1.9 /100 | #237 | Tragic 97.7% |
| Nigerians | 1.7 /100 | #238 | Tragic 97.7% |
| Immigrants | Eastern Asia | 1.6 /100 | #239 | Tragic 97.7% |
| Koreans | 1.4 /100 | #240 | Tragic 97.7% |
Demographics Similar to Malaysians by Nursery School
In terms of nursery school, the demographic groups most similar to Malaysians are Houma (97.3%, a difference of 0.010%), Immigrants from Grenada (97.3%, a difference of 0.010%), Immigrants (97.2%, a difference of 0.020%), British West Indian (97.3%, a difference of 0.030%), and Immigrants from Eritrea (97.2%, a difference of 0.030%).
| Demographics | Rating | Rank | Nursery School |
| Immigrants | Portugal | 0.0 /100 | #286 | Tragic 97.4% |
| Immigrants | Hong Kong | 0.0 /100 | #287 | Tragic 97.4% |
| Immigrants | Thailand | 0.0 /100 | #288 | Tragic 97.3% |
| Immigrants | St. Vincent and the Grenadines | 0.0 /100 | #289 | Tragic 97.3% |
| Immigrants | Afghanistan | 0.0 /100 | #290 | Tragic 97.3% |
| British West Indians | 0.0 /100 | #291 | Tragic 97.3% |
| Houma | 0.0 /100 | #292 | Tragic 97.3% |
| Malaysians | 0.0 /100 | #293 | Tragic 97.3% |
| Immigrants | Grenada | 0.0 /100 | #294 | Tragic 97.3% |
| Immigrants | Immigrants | 0.0 /100 | #295 | Tragic 97.2% |
| Immigrants | Eritrea | 0.0 /100 | #296 | Tragic 97.2% |
| Immigrants | Cuba | 0.0 /100 | #297 | Tragic 97.2% |
| Central American Indians | 0.0 /100 | #298 | Tragic 97.2% |
| Immigrants | Dominica | 0.0 /100 | #299 | Tragic 97.2% |
| Haitians | 0.0 /100 | #300 | Tragic 97.2% |