U.S. Virgin Islander vs Ethiopian Nursery School
COMPARE
U.S. Virgin Islander
Ethiopian
Nursery School
Nursery School Comparison
U.S. Virgin Islanders
Ethiopians
97.7%
NURSERY SCHOOL
2.1/ 100
METRIC RATING
233rd/ 347
METRIC RANK
97.6%
NURSERY SCHOOL
0.8/ 100
METRIC RATING
251st/ 347
METRIC RANK
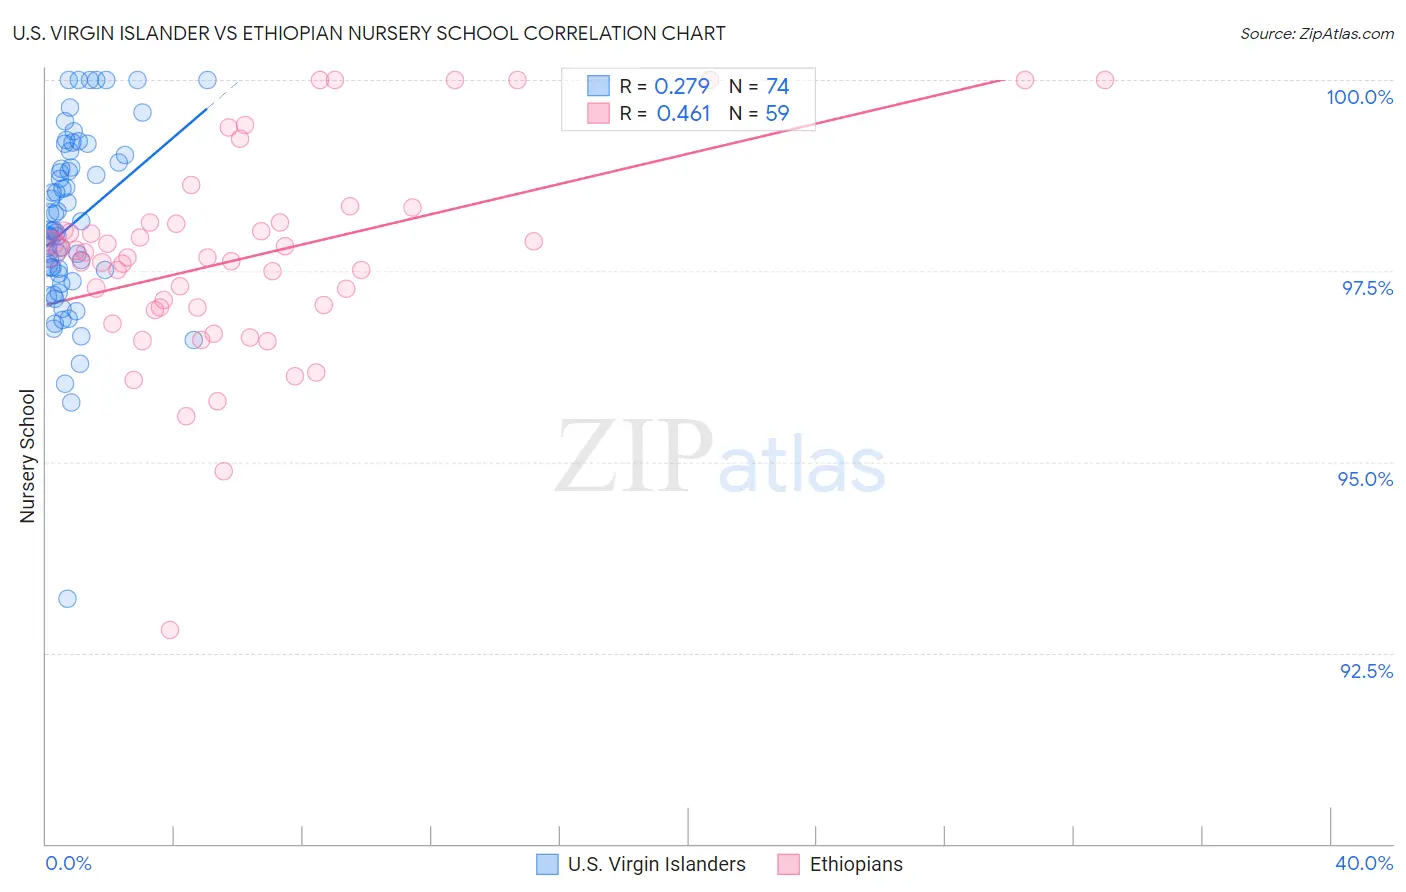
U.S. Virgin Islander vs Ethiopian Nursery School Correlation Chart
The statistical analysis conducted on geographies consisting of 87,529,315 people shows a weak positive correlation between the proportion of U.S. Virgin Islanders and percentage of population with at least nursery school education in the United States with a correlation coefficient (R) of 0.279 and weighted average of 97.7%. Similarly, the statistical analysis conducted on geographies consisting of 223,220,814 people shows a moderate positive correlation between the proportion of Ethiopians and percentage of population with at least nursery school education in the United States with a correlation coefficient (R) of 0.461 and weighted average of 97.6%, a difference of 0.080%.
Nursery School Correlation Summary
| Measurement | U.S. Virgin Islander | Ethiopian |
| Minimum | 93.2% | 92.8% |
| Maximum | 100.0% | 100.0% |
| Range | 6.8% | 7.2% |
| Mean | 98.1% | 97.7% |
| Median | 98.0% | 97.7% |
| Interquartile 25% (IQ1) | 97.5% | 97.0% |
| Interquartile 75% (IQ3) | 98.9% | 98.1% |
| Interquartile Range (IQR) | 1.4% | 1.1% |
| Standard Deviation (Sample) | 1.2% | 1.3% |
| Standard Deviation (Population) | 1.2% | 1.3% |
Demographics Similar to U.S. Virgin Islanders and Ethiopians by Nursery School
In terms of nursery school, the demographic groups most similar to U.S. Virgin Islanders are Colombian (97.7%, a difference of 0.0%), Immigrants from Pakistan (97.7%, a difference of 0.0%), Immigrants from Uruguay (97.7%, a difference of 0.010%), Immigrants from Malaysia (97.7%, a difference of 0.010%), and Immigrants from Western Asia (97.7%, a difference of 0.010%). Similarly, the demographic groups most similar to Ethiopians are Immigrants from Africa (97.6%, a difference of 0.0%), Peruvian (97.6%, a difference of 0.010%), Immigrants from Middle Africa (97.6%, a difference of 0.010%), Indian (Asian) (97.6%, a difference of 0.010%), and Immigrants from Eastern Africa (97.6%, a difference of 0.010%).
| Demographics | Rating | Rank | Nursery School |
| Immigrants | Uruguay | 2.3 /100 | #232 | Tragic 97.7% |
| U.S. Virgin Islanders | 2.1 /100 | #233 | Tragic 97.7% |
| Colombians | 2.1 /100 | #234 | Tragic 97.7% |
| Immigrants | Pakistan | 2.1 /100 | #235 | Tragic 97.7% |
| Immigrants | Malaysia | 1.9 /100 | #236 | Tragic 97.7% |
| Immigrants | Western Asia | 1.9 /100 | #237 | Tragic 97.7% |
| Nigerians | 1.7 /100 | #238 | Tragic 97.7% |
| Immigrants | Eastern Asia | 1.6 /100 | #239 | Tragic 97.7% |
| Koreans | 1.4 /100 | #240 | Tragic 97.7% |
| Immigrants | Indonesia | 1.1 /100 | #241 | Tragic 97.7% |
| Liberians | 1.1 /100 | #242 | Tragic 97.7% |
| Asians | 1.1 /100 | #243 | Tragic 97.6% |
| South Americans | 1.0 /100 | #244 | Tragic 97.6% |
| Bolivians | 1.0 /100 | #245 | Tragic 97.6% |
| Peruvians | 1.0 /100 | #246 | Tragic 97.6% |
| Immigrants | Middle Africa | 0.9 /100 | #247 | Tragic 97.6% |
| Indians (Asian) | 0.9 /100 | #248 | Tragic 97.6% |
| Immigrants | Eastern Africa | 0.9 /100 | #249 | Tragic 97.6% |
| Immigrants | Senegal | 0.9 /100 | #250 | Tragic 97.6% |
| Ethiopians | 0.8 /100 | #251 | Tragic 97.6% |
| Immigrants | Africa | 0.8 /100 | #252 | Tragic 97.6% |