Fijian vs Bermudan Nursery School
COMPARE
Fijian
Bermudan
Nursery School
Nursery School Comparison
Fijians
Bermudans
97.6%
NURSERY SCHOOL
0.3/ 100
METRIC RATING
263rd/ 347
METRIC RANK
98.0%
NURSERY SCHOOL
53.7/ 100
METRIC RATING
170th/ 347
METRIC RANK
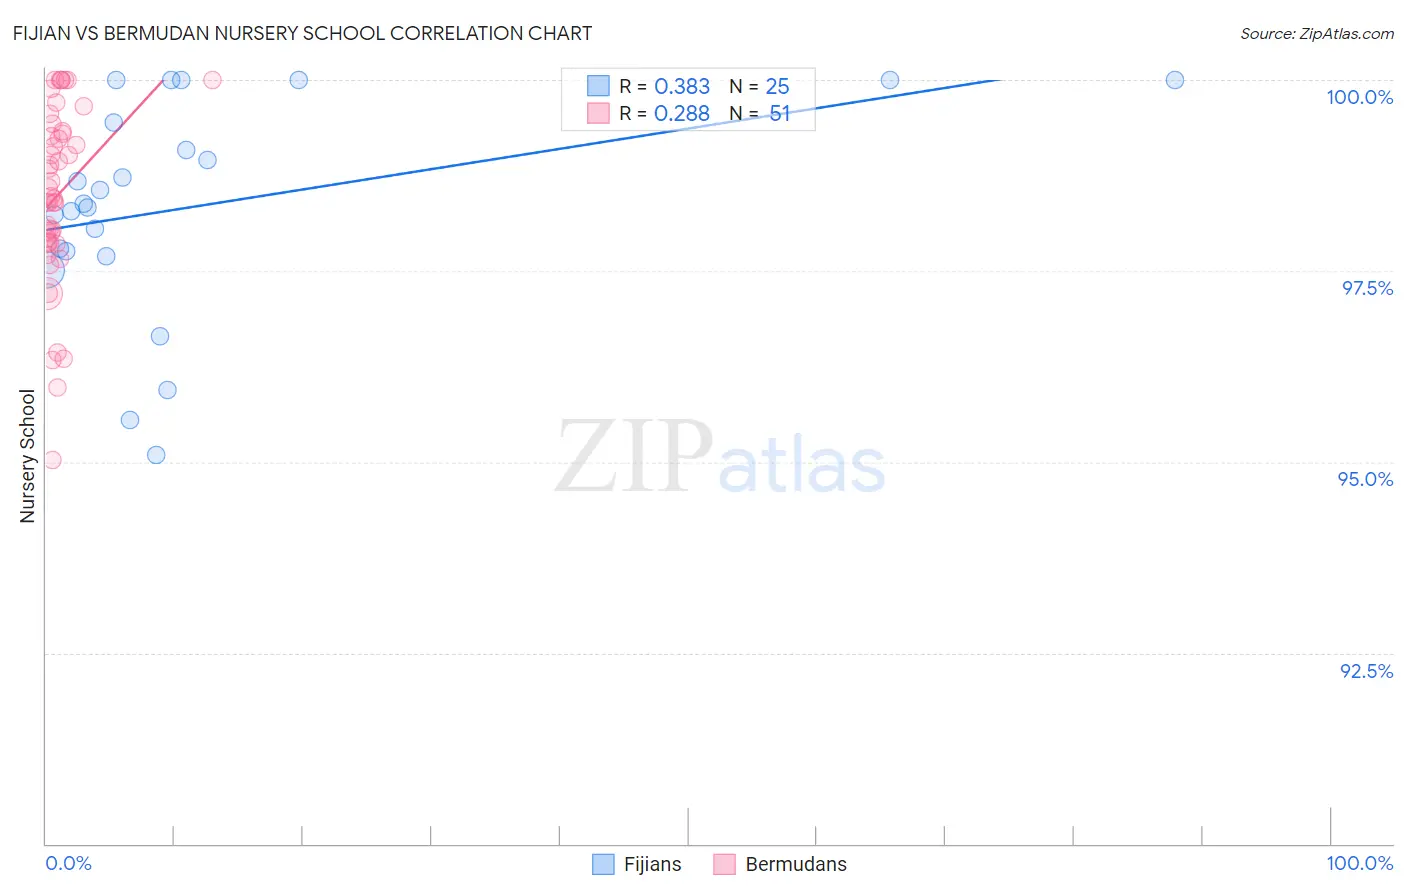
Fijian vs Bermudan Nursery School Correlation Chart
The statistical analysis conducted on geographies consisting of 55,948,842 people shows a mild positive correlation between the proportion of Fijians and percentage of population with at least nursery school education in the United States with a correlation coefficient (R) of 0.383 and weighted average of 97.6%. Similarly, the statistical analysis conducted on geographies consisting of 55,721,975 people shows a weak positive correlation between the proportion of Bermudans and percentage of population with at least nursery school education in the United States with a correlation coefficient (R) of 0.288 and weighted average of 98.0%, a difference of 0.44%.
Nursery School Correlation Summary
| Measurement | Fijian | Bermudan |
| Minimum | 95.1% | 95.0% |
| Maximum | 100.0% | 100.0% |
| Range | 4.9% | 5.0% |
| Mean | 98.3% | 98.5% |
| Median | 98.4% | 98.5% |
| Interquartile 25% (IQ1) | 97.7% | 97.9% |
| Interquartile 75% (IQ3) | 99.7% | 99.3% |
| Interquartile Range (IQR) | 2.0% | 1.5% |
| Standard Deviation (Sample) | 1.4% | 1.2% |
| Standard Deviation (Population) | 1.4% | 1.1% |
Similar Demographics by Nursery School
Demographics Similar to Fijians by Nursery School
In terms of nursery school, the demographic groups most similar to Fijians are Immigrants from Ethiopia (97.6%, a difference of 0.0%), Taiwanese (97.6%, a difference of 0.0%), Assyrian/Chaldean/Syriac (97.6%, a difference of 0.0%), Immigrants from South America (97.6%, a difference of 0.010%), and Cuban (97.6%, a difference of 0.010%).
| Demographics | Rating | Rank | Nursery School |
| Yaqui | 0.6 /100 | #256 | Tragic 97.6% |
| Immigrants | Colombia | 0.6 /100 | #257 | Tragic 97.6% |
| Jamaicans | 0.6 /100 | #258 | Tragic 97.6% |
| Armenians | 0.4 /100 | #259 | Tragic 97.6% |
| Immigrants | South America | 0.4 /100 | #260 | Tragic 97.6% |
| Cubans | 0.4 /100 | #261 | Tragic 97.6% |
| Immigrants | Ethiopia | 0.4 /100 | #262 | Tragic 97.6% |
| Fijians | 0.3 /100 | #263 | Tragic 97.6% |
| Taiwanese | 0.3 /100 | #264 | Tragic 97.6% |
| Assyrians/Chaldeans/Syriacs | 0.3 /100 | #265 | Tragic 97.6% |
| Immigrants | Sierra Leone | 0.3 /100 | #266 | Tragic 97.6% |
| Immigrants | Nigeria | 0.3 /100 | #267 | Tragic 97.5% |
| West Indians | 0.3 /100 | #268 | Tragic 97.5% |
| Immigrants | Liberia | 0.3 /100 | #269 | Tragic 97.5% |
| Immigrants | Jamaica | 0.2 /100 | #270 | Tragic 97.5% |
Demographics Similar to Bermudans by Nursery School
In terms of nursery school, the demographic groups most similar to Bermudans are Immigrants from Micronesia (98.0%, a difference of 0.0%), Immigrants from Korea (98.0%, a difference of 0.0%), Immigrants from Jordan (98.0%, a difference of 0.0%), Ugandan (98.0%, a difference of 0.010%), and Chilean (98.0%, a difference of 0.010%).
| Demographics | Rating | Rank | Nursery School |
| Immigrants | Italy | 59.0 /100 | #163 | Average 98.0% |
| Ugandans | 56.4 /100 | #164 | Average 98.0% |
| Chileans | 56.4 /100 | #165 | Average 98.0% |
| Spanish Americans | 55.6 /100 | #166 | Average 98.0% |
| Immigrants | Spain | 55.6 /100 | #167 | Average 98.0% |
| Immigrants | Micronesia | 55.0 /100 | #168 | Average 98.0% |
| Immigrants | Korea | 53.8 /100 | #169 | Average 98.0% |
| Bermudans | 53.7 /100 | #170 | Average 98.0% |
| Immigrants | Jordan | 53.4 /100 | #171 | Average 98.0% |
| Immigrants | Brazil | 51.3 /100 | #172 | Average 98.0% |
| Kenyans | 50.2 /100 | #173 | Average 98.0% |
| Navajo | 50.0 /100 | #174 | Average 98.0% |
| Immigrants | Sri Lanka | 49.9 /100 | #175 | Average 98.0% |
| Immigrants | Venezuela | 49.8 /100 | #176 | Average 98.0% |
| Albanians | 48.9 /100 | #177 | Average 98.0% |