Immigrants from Germany vs Bermudan Nursery School
COMPARE
Immigrants from Germany
Bermudan
Nursery School
Nursery School Comparison
Immigrants from Germany
Bermudans
98.3%
NURSERY SCHOOL
98.6/ 100
METRIC RATING
94th/ 347
METRIC RANK
98.0%
NURSERY SCHOOL
53.7/ 100
METRIC RATING
170th/ 347
METRIC RANK
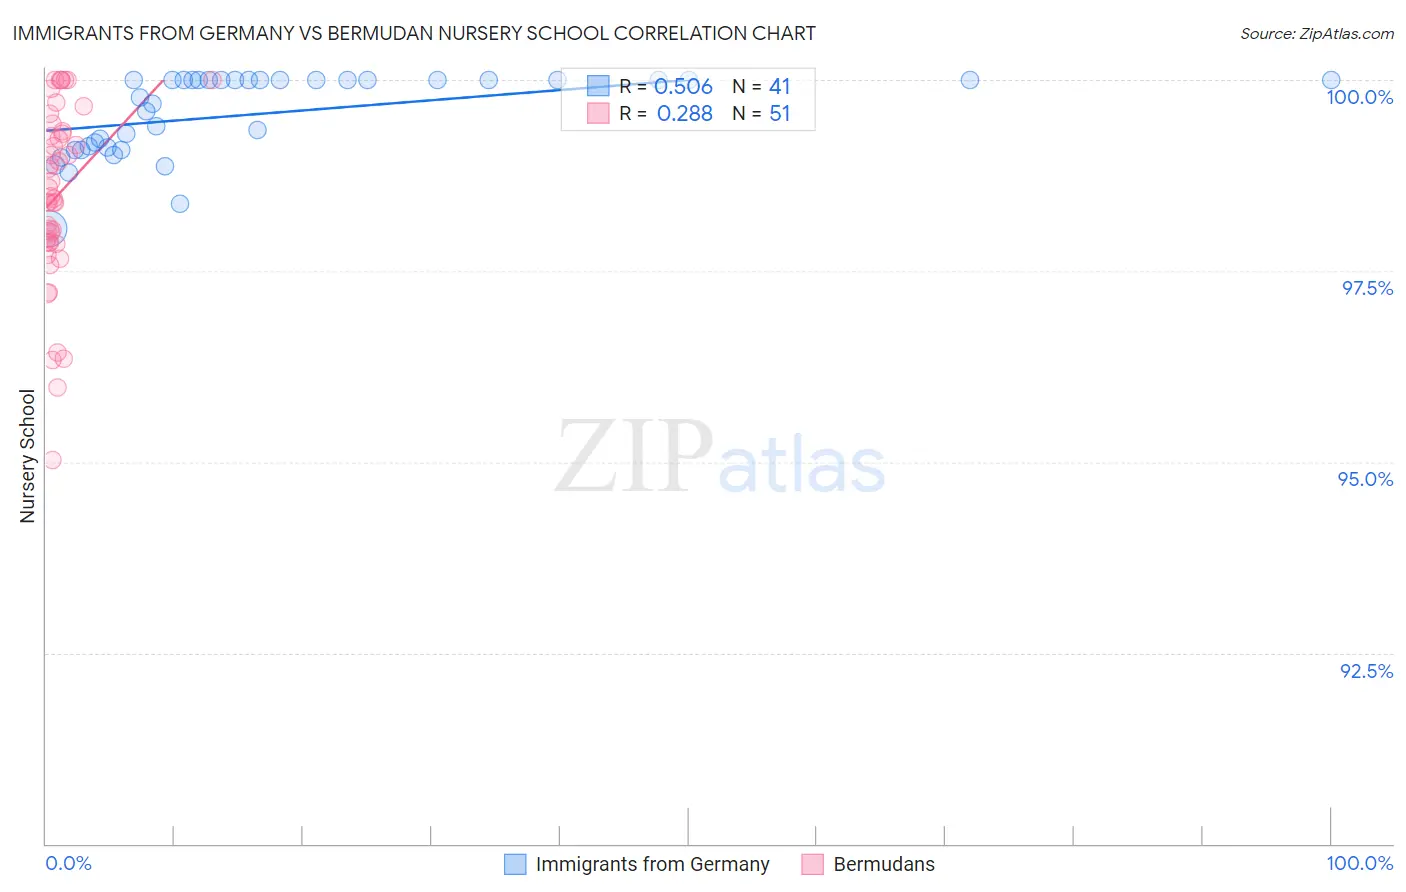
Immigrants from Germany vs Bermudan Nursery School Correlation Chart
The statistical analysis conducted on geographies consisting of 463,886,643 people shows a substantial positive correlation between the proportion of Immigrants from Germany and percentage of population with at least nursery school education in the United States with a correlation coefficient (R) of 0.506 and weighted average of 98.3%. Similarly, the statistical analysis conducted on geographies consisting of 55,721,975 people shows a weak positive correlation between the proportion of Bermudans and percentage of population with at least nursery school education in the United States with a correlation coefficient (R) of 0.288 and weighted average of 98.0%, a difference of 0.31%.
Nursery School Correlation Summary
| Measurement | Immigrants from Germany | Bermudan |
| Minimum | 98.1% | 95.0% |
| Maximum | 100.0% | 100.0% |
| Range | 1.9% | 5.0% |
| Mean | 99.6% | 98.5% |
| Median | 100.0% | 98.5% |
| Interquartile 25% (IQ1) | 99.1% | 97.9% |
| Interquartile 75% (IQ3) | 100.0% | 99.3% |
| Interquartile Range (IQR) | 0.90% | 1.5% |
| Standard Deviation (Sample) | 0.53% | 1.2% |
| Standard Deviation (Population) | 0.53% | 1.1% |
Similar Demographics by Nursery School
Demographics Similar to Immigrants from Germany by Nursery School
In terms of nursery school, the demographic groups most similar to Immigrants from Germany are South African (98.3%, a difference of 0.0%), Immigrants from Western Europe (98.3%, a difference of 0.010%), Zimbabwean (98.3%, a difference of 0.010%), Macedonian (98.3%, a difference of 0.010%), and Immigrants from India (98.3%, a difference of 0.010%).
| Demographics | Rating | Rank | Nursery School |
| Hopi | 98.9 /100 | #87 | Exceptional 98.3% |
| Ukrainians | 98.9 /100 | #88 | Exceptional 98.3% |
| Immigrants | South Africa | 98.8 /100 | #89 | Exceptional 98.3% |
| Immigrants | Western Europe | 98.8 /100 | #90 | Exceptional 98.3% |
| Zimbabweans | 98.8 /100 | #91 | Exceptional 98.3% |
| Macedonians | 98.7 /100 | #92 | Exceptional 98.3% |
| Immigrants | India | 98.7 /100 | #93 | Exceptional 98.3% |
| Immigrants | Germany | 98.6 /100 | #94 | Exceptional 98.3% |
| South Africans | 98.6 /100 | #95 | Exceptional 98.3% |
| Cypriots | 98.3 /100 | #96 | Exceptional 98.3% |
| Immigrants | Nonimmigrants | 98.3 /100 | #97 | Exceptional 98.3% |
| Choctaw | 98.3 /100 | #98 | Exceptional 98.3% |
| Colville | 98.2 /100 | #99 | Exceptional 98.3% |
| Puget Sound Salish | 98.0 /100 | #100 | Exceptional 98.3% |
| Romanians | 97.9 /100 | #101 | Exceptional 98.3% |
Demographics Similar to Bermudans by Nursery School
In terms of nursery school, the demographic groups most similar to Bermudans are Immigrants from Micronesia (98.0%, a difference of 0.0%), Immigrants from Korea (98.0%, a difference of 0.0%), Immigrants from Jordan (98.0%, a difference of 0.0%), Ugandan (98.0%, a difference of 0.010%), and Chilean (98.0%, a difference of 0.010%).
| Demographics | Rating | Rank | Nursery School |
| Immigrants | Italy | 59.0 /100 | #163 | Average 98.0% |
| Ugandans | 56.4 /100 | #164 | Average 98.0% |
| Chileans | 56.4 /100 | #165 | Average 98.0% |
| Spanish Americans | 55.6 /100 | #166 | Average 98.0% |
| Immigrants | Spain | 55.6 /100 | #167 | Average 98.0% |
| Immigrants | Micronesia | 55.0 /100 | #168 | Average 98.0% |
| Immigrants | Korea | 53.8 /100 | #169 | Average 98.0% |
| Bermudans | 53.7 /100 | #170 | Average 98.0% |
| Immigrants | Jordan | 53.4 /100 | #171 | Average 98.0% |
| Immigrants | Brazil | 51.3 /100 | #172 | Average 98.0% |
| Kenyans | 50.2 /100 | #173 | Average 98.0% |
| Navajo | 50.0 /100 | #174 | Average 98.0% |
| Immigrants | Sri Lanka | 49.9 /100 | #175 | Average 98.0% |
| Immigrants | Venezuela | 49.8 /100 | #176 | Average 98.0% |
| Albanians | 48.9 /100 | #177 | Average 98.0% |