U.S. Virgin Islander vs Hispanic or Latino Nursery School
COMPARE
U.S. Virgin Islander
Hispanic or Latino
Nursery School
Nursery School Comparison
U.S. Virgin Islanders
Hispanics or Latinos
97.7%
NURSERY SCHOOL
2.1/ 100
METRIC RATING
233rd/ 347
METRIC RANK
97.0%
NURSERY SCHOOL
0.0/ 100
METRIC RATING
307th/ 347
METRIC RANK
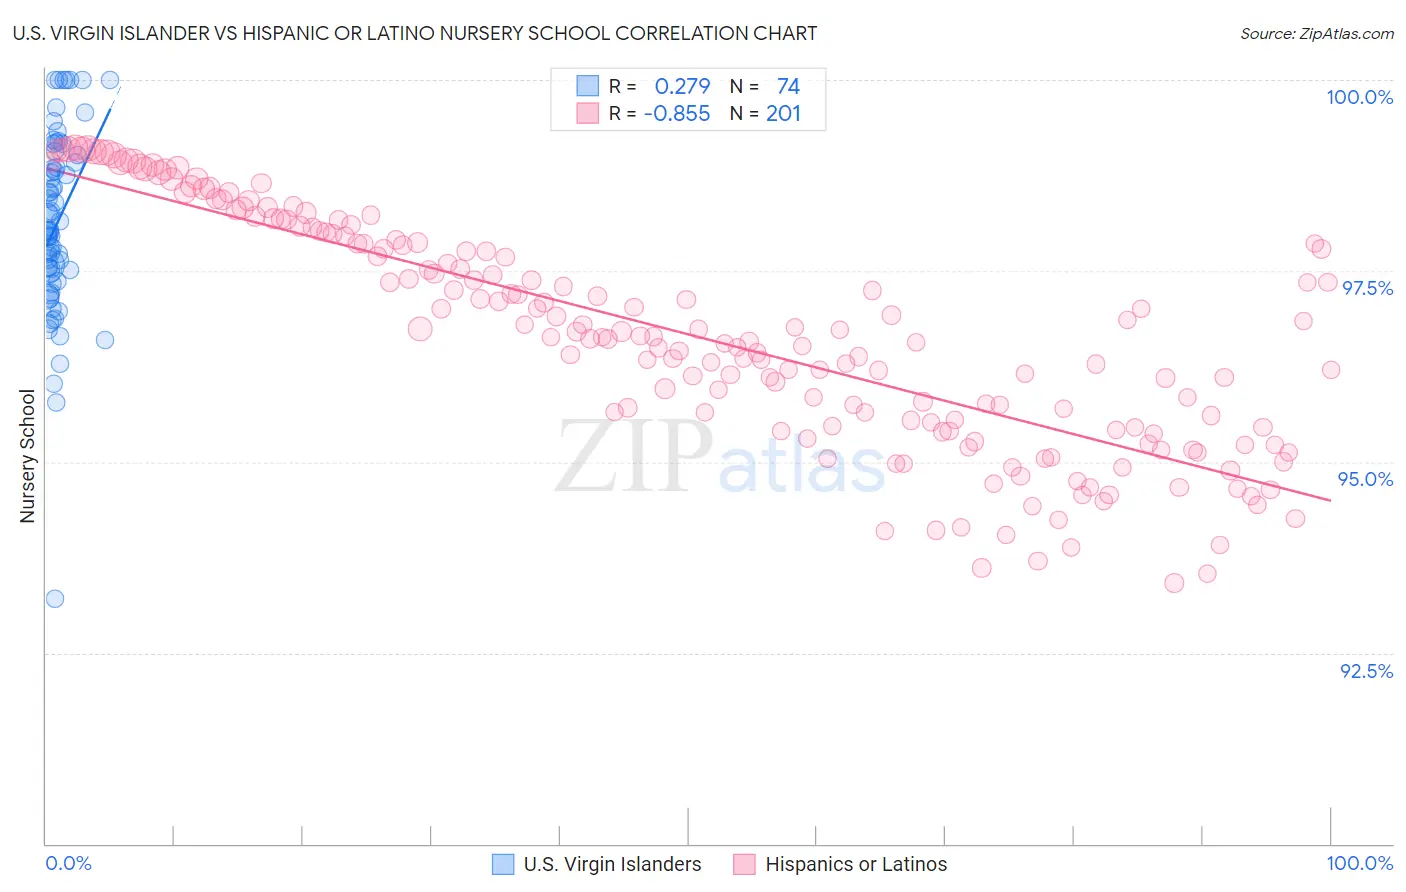
U.S. Virgin Islander vs Hispanic or Latino Nursery School Correlation Chart
The statistical analysis conducted on geographies consisting of 87,529,315 people shows a weak positive correlation between the proportion of U.S. Virgin Islanders and percentage of population with at least nursery school education in the United States with a correlation coefficient (R) of 0.279 and weighted average of 97.7%. Similarly, the statistical analysis conducted on geographies consisting of 578,615,396 people shows a very strong negative correlation between the proportion of Hispanics or Latinos and percentage of population with at least nursery school education in the United States with a correlation coefficient (R) of -0.855 and weighted average of 97.0%, a difference of 0.71%.
Nursery School Correlation Summary
| Measurement | U.S. Virgin Islander | Hispanic or Latino |
| Minimum | 93.2% | 93.4% |
| Maximum | 100.0% | 99.1% |
| Range | 6.8% | 5.7% |
| Mean | 98.1% | 96.7% |
| Median | 98.0% | 96.6% |
| Interquartile 25% (IQ1) | 97.5% | 95.4% |
| Interquartile 75% (IQ3) | 98.9% | 97.9% |
| Interquartile Range (IQR) | 1.4% | 2.4% |
| Standard Deviation (Sample) | 1.2% | 1.5% |
| Standard Deviation (Population) | 1.2% | 1.5% |
Similar Demographics by Nursery School
Demographics Similar to U.S. Virgin Islanders by Nursery School
In terms of nursery school, the demographic groups most similar to U.S. Virgin Islanders are Colombian (97.7%, a difference of 0.0%), Immigrants from Pakistan (97.7%, a difference of 0.0%), Puerto Rican (97.7%, a difference of 0.010%), Immigrants from Uruguay (97.7%, a difference of 0.010%), and Immigrants from Malaysia (97.7%, a difference of 0.010%).
| Demographics | Rating | Rank | Nursery School |
| Iraqis | 3.5 /100 | #226 | Tragic 97.7% |
| Sub-Saharan Africans | 3.2 /100 | #227 | Tragic 97.7% |
| Sudanese | 3.2 /100 | #228 | Tragic 97.7% |
| Senegalese | 3.2 /100 | #229 | Tragic 97.7% |
| Sierra Leoneans | 2.9 /100 | #230 | Tragic 97.7% |
| Puerto Ricans | 2.6 /100 | #231 | Tragic 97.7% |
| Immigrants | Uruguay | 2.3 /100 | #232 | Tragic 97.7% |
| U.S. Virgin Islanders | 2.1 /100 | #233 | Tragic 97.7% |
| Colombians | 2.1 /100 | #234 | Tragic 97.7% |
| Immigrants | Pakistan | 2.1 /100 | #235 | Tragic 97.7% |
| Immigrants | Malaysia | 1.9 /100 | #236 | Tragic 97.7% |
| Immigrants | Western Asia | 1.9 /100 | #237 | Tragic 97.7% |
| Nigerians | 1.7 /100 | #238 | Tragic 97.7% |
| Immigrants | Eastern Asia | 1.6 /100 | #239 | Tragic 97.7% |
| Koreans | 1.4 /100 | #240 | Tragic 97.7% |
Demographics Similar to Hispanics or Latinos by Nursery School
In terms of nursery school, the demographic groups most similar to Hispanics or Latinos are Immigrants from Haiti (97.0%, a difference of 0.0%), Belizean (97.0%, a difference of 0.010%), Immigrants from Somalia (97.0%, a difference of 0.010%), Guyanese (97.0%, a difference of 0.030%), and Immigrants from the Azores (97.0%, a difference of 0.030%).
| Demographics | Rating | Rank | Nursery School |
| Haitians | 0.0 /100 | #300 | Tragic 97.2% |
| Immigrants | South Eastern Asia | 0.0 /100 | #301 | Tragic 97.1% |
| Immigrants | Caribbean | 0.0 /100 | #302 | Tragic 97.1% |
| Nicaraguans | 0.0 /100 | #303 | Tragic 97.1% |
| Ecuadorians | 0.0 /100 | #304 | Tragic 97.1% |
| Somalis | 0.0 /100 | #305 | Tragic 97.1% |
| Belizeans | 0.0 /100 | #306 | Tragic 97.0% |
| Hispanics or Latinos | 0.0 /100 | #307 | Tragic 97.0% |
| Immigrants | Haiti | 0.0 /100 | #308 | Tragic 97.0% |
| Immigrants | Somalia | 0.0 /100 | #309 | Tragic 97.0% |
| Guyanese | 0.0 /100 | #310 | Tragic 97.0% |
| Immigrants | Azores | 0.0 /100 | #311 | Tragic 97.0% |
| Sri Lankans | 0.0 /100 | #312 | Tragic 97.0% |
| Hondurans | 0.0 /100 | #313 | Tragic 97.0% |
| Cape Verdeans | 0.0 /100 | #314 | Tragic 97.0% |