Uruguayan vs Immigrants from Trinidad and Tobago 7th Grade
COMPARE
Uruguayan
Immigrants from Trinidad and Tobago
7th Grade
7th Grade Comparison
Uruguayans
Immigrants from Trinidad and Tobago
95.4%
7TH GRADE
1.6/ 100
METRIC RATING
244th/ 347
METRIC RANK
95.1%
7TH GRADE
0.1/ 100
METRIC RATING
278th/ 347
METRIC RANK
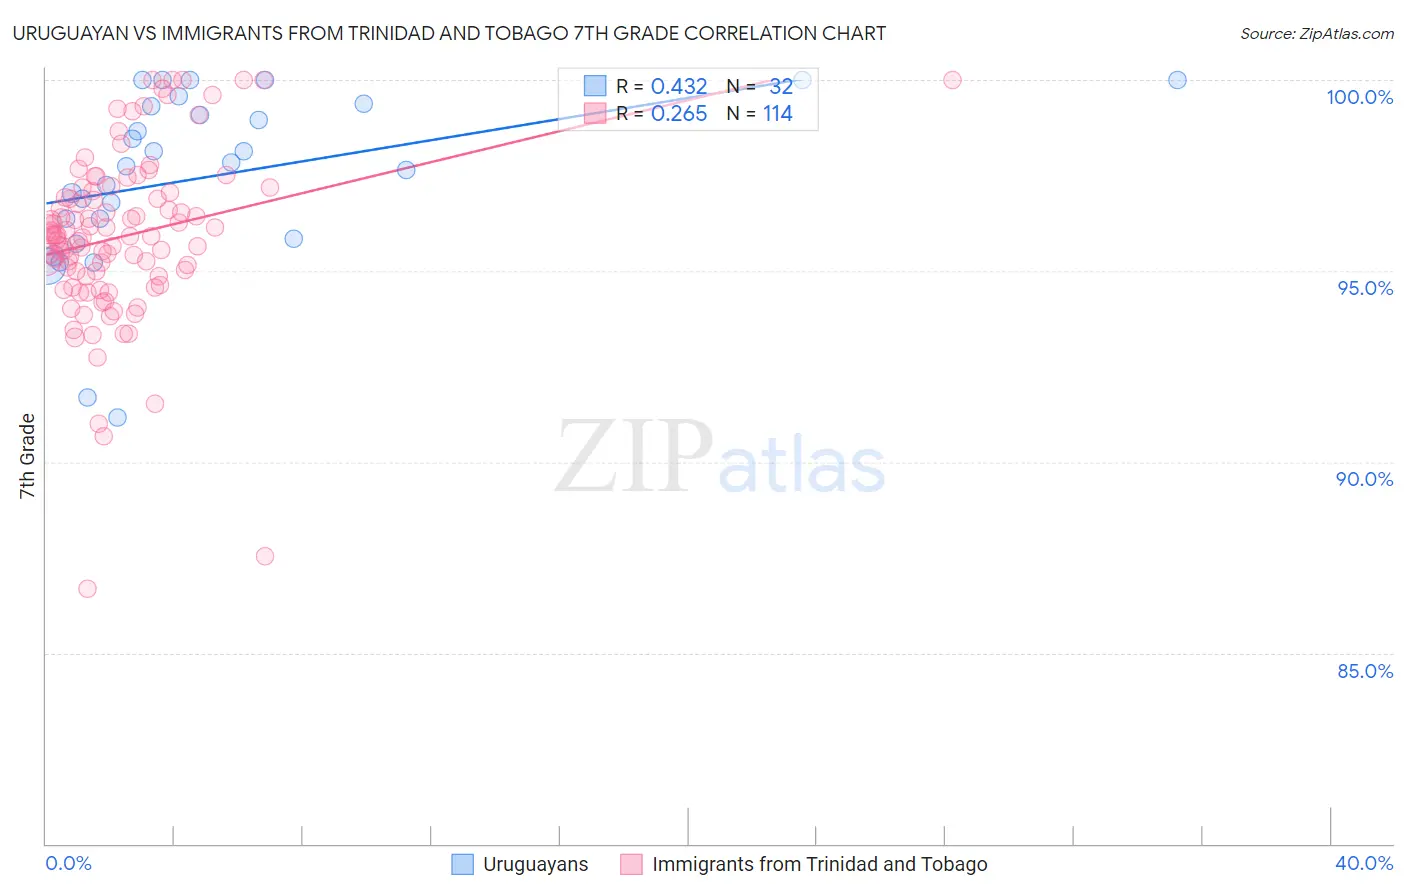
Uruguayan vs Immigrants from Trinidad and Tobago 7th Grade Correlation Chart
The statistical analysis conducted on geographies consisting of 144,782,794 people shows a moderate positive correlation between the proportion of Uruguayans and percentage of population with at least 7th grade education in the United States with a correlation coefficient (R) of 0.432 and weighted average of 95.4%. Similarly, the statistical analysis conducted on geographies consisting of 223,526,834 people shows a weak positive correlation between the proportion of Immigrants from Trinidad and Tobago and percentage of population with at least 7th grade education in the United States with a correlation coefficient (R) of 0.265 and weighted average of 95.1%, a difference of 0.40%.
7th Grade Correlation Summary
| Measurement | Uruguayan | Immigrants from Trinidad and Tobago |
| Minimum | 91.2% | 86.7% |
| Maximum | 100.0% | 100.0% |
| Range | 8.8% | 13.3% |
| Mean | 97.5% | 95.9% |
| Median | 97.8% | 95.9% |
| Interquartile 25% (IQ1) | 96.1% | 94.9% |
| Interquartile 75% (IQ3) | 99.3% | 97.1% |
| Interquartile Range (IQR) | 3.3% | 2.2% |
| Standard Deviation (Sample) | 2.3% | 2.2% |
| Standard Deviation (Population) | 2.2% | 2.2% |
Similar Demographics by 7th Grade
Demographics Similar to Uruguayans by 7th Grade
In terms of 7th grade, the demographic groups most similar to Uruguayans are U.S. Virgin Islander (95.4%, a difference of 0.0%), Immigrants from Middle Africa (95.4%, a difference of 0.010%), Ethiopian (95.4%, a difference of 0.010%), Immigrants from Sierra Leone (95.5%, a difference of 0.030%), and South American Indian (95.5%, a difference of 0.030%).
| Demographics | Rating | Rank | 7th Grade |
| Immigrants | Asia | 2.3 /100 | #237 | Tragic 95.5% |
| Indians (Asian) | 2.3 /100 | #238 | Tragic 95.5% |
| Jamaicans | 2.2 /100 | #239 | Tragic 95.5% |
| Immigrants | Sierra Leone | 2.0 /100 | #240 | Tragic 95.5% |
| South American Indians | 2.0 /100 | #241 | Tragic 95.5% |
| Immigrants | Senegal | 1.9 /100 | #242 | Tragic 95.5% |
| U.S. Virgin Islanders | 1.6 /100 | #243 | Tragic 95.4% |
| Uruguayans | 1.6 /100 | #244 | Tragic 95.4% |
| Immigrants | Middle Africa | 1.5 /100 | #245 | Tragic 95.4% |
| Ethiopians | 1.5 /100 | #246 | Tragic 95.4% |
| Tongans | 1.3 /100 | #247 | Tragic 95.4% |
| Paiute | 1.2 /100 | #248 | Tragic 95.4% |
| Bolivians | 1.1 /100 | #249 | Tragic 95.4% |
| Immigrants | Cameroon | 0.9 /100 | #250 | Tragic 95.4% |
| Immigrants | Jamaica | 0.9 /100 | #251 | Tragic 95.4% |
Demographics Similar to Immigrants from Trinidad and Tobago by 7th Grade
In terms of 7th grade, the demographic groups most similar to Immigrants from Trinidad and Tobago are Barbadian (95.1%, a difference of 0.010%), Immigrants from Afghanistan (95.1%, a difference of 0.030%), Immigrants from St. Vincent and the Grenadines (95.0%, a difference of 0.030%), Tohono O'odham (95.0%, a difference of 0.040%), and Immigrants from Thailand (95.1%, a difference of 0.050%).
| Demographics | Rating | Rank | 7th Grade |
| Immigrants | South America | 0.2 /100 | #271 | Tragic 95.1% |
| Peruvians | 0.2 /100 | #272 | Tragic 95.1% |
| Immigrants | Uzbekistan | 0.2 /100 | #273 | Tragic 95.1% |
| Immigrants | Western Africa | 0.2 /100 | #274 | Tragic 95.1% |
| Immigrants | Colombia | 0.2 /100 | #275 | Tragic 95.1% |
| Immigrants | Thailand | 0.2 /100 | #276 | Tragic 95.1% |
| Immigrants | Afghanistan | 0.2 /100 | #277 | Tragic 95.1% |
| Immigrants | Trinidad and Tobago | 0.1 /100 | #278 | Tragic 95.1% |
| Barbadians | 0.1 /100 | #279 | Tragic 95.1% |
| Immigrants | St. Vincent and the Grenadines | 0.1 /100 | #280 | Tragic 95.0% |
| Tohono O'odham | 0.1 /100 | #281 | Tragic 95.0% |
| Immigrants | Bolivia | 0.1 /100 | #282 | Tragic 95.0% |
| Immigrants | Barbados | 0.1 /100 | #283 | Tragic 95.0% |
| Armenians | 0.1 /100 | #284 | Tragic 95.0% |
| Immigrants | Eritrea | 0.1 /100 | #285 | Tragic 94.9% |