Salvadoran vs Immigrants from Trinidad and Tobago 7th Grade
COMPARE
Salvadoran
Immigrants from Trinidad and Tobago
7th Grade
7th Grade Comparison
Salvadorans
Immigrants from Trinidad and Tobago
91.5%
7TH GRADE
0.0/ 100
METRIC RATING
342nd/ 347
METRIC RANK
95.1%
7TH GRADE
0.1/ 100
METRIC RATING
278th/ 347
METRIC RANK
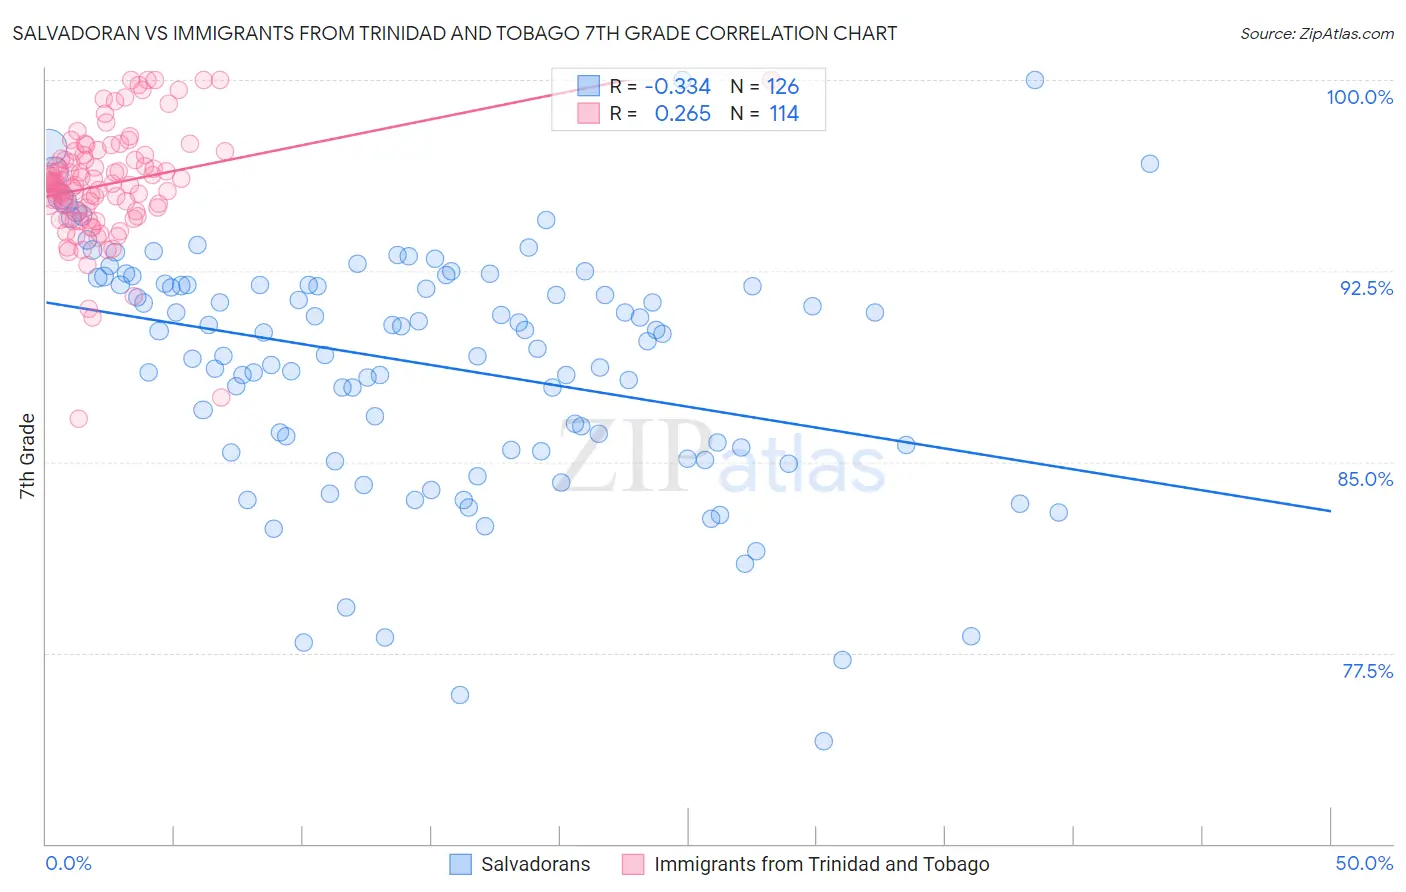
Salvadoran vs Immigrants from Trinidad and Tobago 7th Grade Correlation Chart
The statistical analysis conducted on geographies consisting of 399,020,248 people shows a mild negative correlation between the proportion of Salvadorans and percentage of population with at least 7th grade education in the United States with a correlation coefficient (R) of -0.334 and weighted average of 91.5%. Similarly, the statistical analysis conducted on geographies consisting of 223,526,834 people shows a weak positive correlation between the proportion of Immigrants from Trinidad and Tobago and percentage of population with at least 7th grade education in the United States with a correlation coefficient (R) of 0.265 and weighted average of 95.1%, a difference of 3.9%.
7th Grade Correlation Summary
| Measurement | Salvadoran | Immigrants from Trinidad and Tobago |
| Minimum | 74.0% | 86.7% |
| Maximum | 100.0% | 100.0% |
| Range | 26.0% | 13.3% |
| Mean | 88.8% | 95.9% |
| Median | 90.1% | 95.9% |
| Interquartile 25% (IQ1) | 85.6% | 94.9% |
| Interquartile 75% (IQ3) | 92.0% | 97.1% |
| Interquartile Range (IQR) | 6.4% | 2.2% |
| Standard Deviation (Sample) | 4.8% | 2.2% |
| Standard Deviation (Population) | 4.8% | 2.2% |
Similar Demographics by 7th Grade
Demographics Similar to Salvadorans by 7th Grade
In terms of 7th grade, the demographic groups most similar to Salvadorans are Immigrants from Guatemala (91.3%, a difference of 0.16%), Guatemalan (91.7%, a difference of 0.27%), Yakama (91.7%, a difference of 0.29%), Mexican (91.9%, a difference of 0.49%), and Immigrants from Central America (91.0%, a difference of 0.52%).
| Demographics | Rating | Rank | 7th Grade |
| Immigrants | Armenia | 0.0 /100 | #333 | Tragic 92.7% |
| Immigrants | Yemen | 0.0 /100 | #334 | Tragic 92.6% |
| Mexican American Indians | 0.0 /100 | #335 | Tragic 92.6% |
| Immigrants | Honduras | 0.0 /100 | #336 | Tragic 92.5% |
| Immigrants | Latin America | 0.0 /100 | #337 | Tragic 92.2% |
| Central Americans | 0.0 /100 | #338 | Tragic 92.1% |
| Mexicans | 0.0 /100 | #339 | Tragic 91.9% |
| Yakama | 0.0 /100 | #340 | Tragic 91.7% |
| Guatemalans | 0.0 /100 | #341 | Tragic 91.7% |
| Salvadorans | 0.0 /100 | #342 | Tragic 91.5% |
| Immigrants | Guatemala | 0.0 /100 | #343 | Tragic 91.3% |
| Immigrants | Central America | 0.0 /100 | #344 | Tragic 91.0% |
| Immigrants | El Salvador | 0.0 /100 | #345 | Tragic 90.9% |
| Immigrants | Mexico | 0.0 /100 | #346 | Tragic 90.7% |
| Spanish American Indians | 0.0 /100 | #347 | Tragic 90.3% |
Demographics Similar to Immigrants from Trinidad and Tobago by 7th Grade
In terms of 7th grade, the demographic groups most similar to Immigrants from Trinidad and Tobago are Barbadian (95.1%, a difference of 0.010%), Immigrants from Afghanistan (95.1%, a difference of 0.030%), Immigrants from St. Vincent and the Grenadines (95.0%, a difference of 0.030%), Tohono O'odham (95.0%, a difference of 0.040%), and Immigrants from Thailand (95.1%, a difference of 0.050%).
| Demographics | Rating | Rank | 7th Grade |
| Immigrants | South America | 0.2 /100 | #271 | Tragic 95.1% |
| Peruvians | 0.2 /100 | #272 | Tragic 95.1% |
| Immigrants | Uzbekistan | 0.2 /100 | #273 | Tragic 95.1% |
| Immigrants | Western Africa | 0.2 /100 | #274 | Tragic 95.1% |
| Immigrants | Colombia | 0.2 /100 | #275 | Tragic 95.1% |
| Immigrants | Thailand | 0.2 /100 | #276 | Tragic 95.1% |
| Immigrants | Afghanistan | 0.2 /100 | #277 | Tragic 95.1% |
| Immigrants | Trinidad and Tobago | 0.1 /100 | #278 | Tragic 95.1% |
| Barbadians | 0.1 /100 | #279 | Tragic 95.1% |
| Immigrants | St. Vincent and the Grenadines | 0.1 /100 | #280 | Tragic 95.0% |
| Tohono O'odham | 0.1 /100 | #281 | Tragic 95.0% |
| Immigrants | Bolivia | 0.1 /100 | #282 | Tragic 95.0% |
| Immigrants | Barbados | 0.1 /100 | #283 | Tragic 95.0% |
| Armenians | 0.1 /100 | #284 | Tragic 95.0% |
| Immigrants | Eritrea | 0.1 /100 | #285 | Tragic 94.9% |