Sri Lankan vs Immigrants from Trinidad and Tobago 7th Grade
COMPARE
Sri Lankan
Immigrants from Trinidad and Tobago
7th Grade
7th Grade Comparison
Sri Lankans
Immigrants from Trinidad and Tobago
94.4%
7TH GRADE
0.0/ 100
METRIC RATING
303rd/ 347
METRIC RANK
95.1%
7TH GRADE
0.1/ 100
METRIC RATING
278th/ 347
METRIC RANK
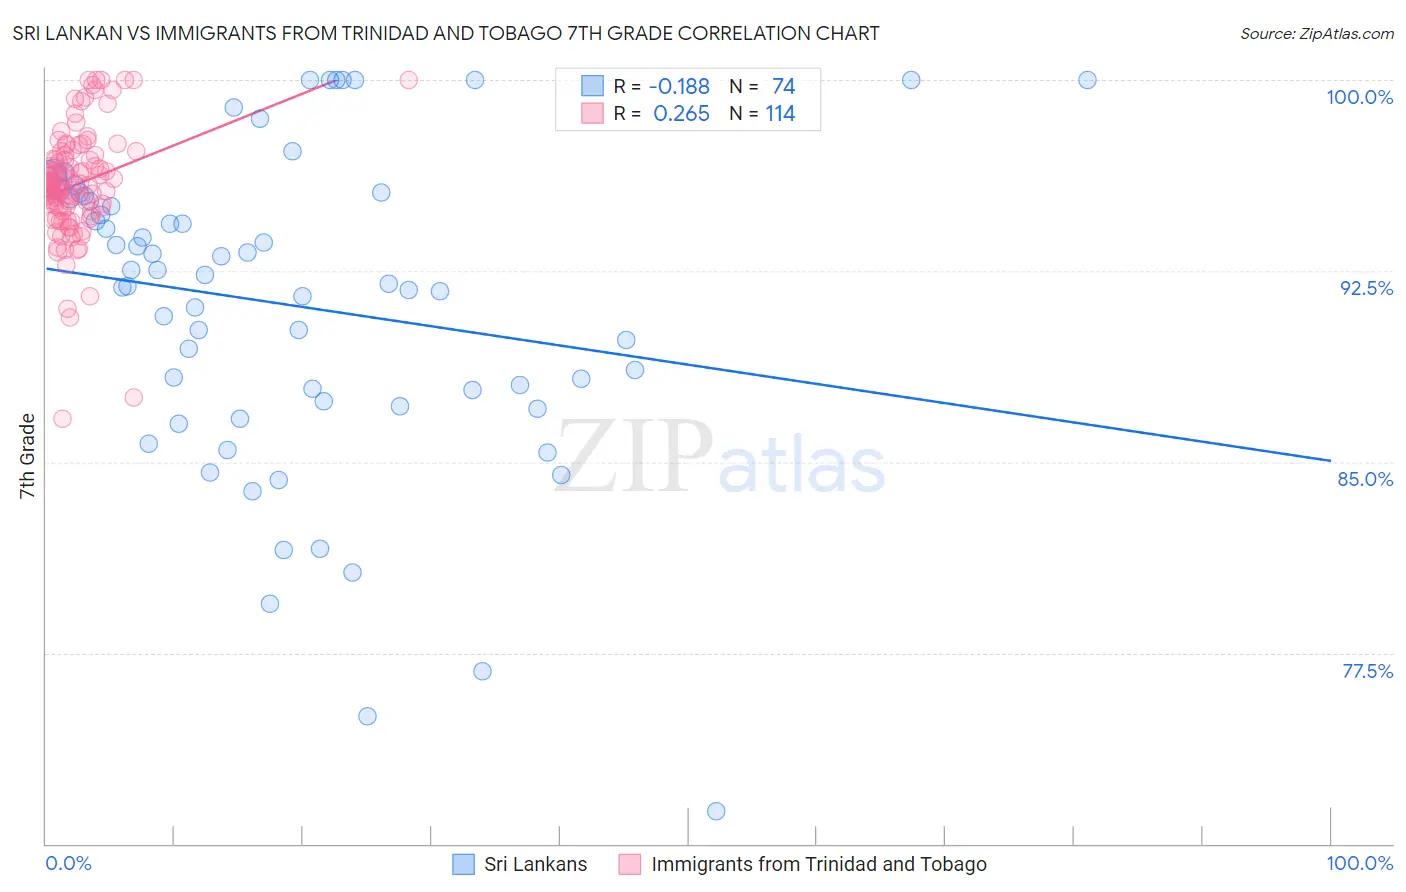
Sri Lankan vs Immigrants from Trinidad and Tobago 7th Grade Correlation Chart
The statistical analysis conducted on geographies consisting of 440,593,938 people shows a poor negative correlation between the proportion of Sri Lankans and percentage of population with at least 7th grade education in the United States with a correlation coefficient (R) of -0.188 and weighted average of 94.4%. Similarly, the statistical analysis conducted on geographies consisting of 223,526,834 people shows a weak positive correlation between the proportion of Immigrants from Trinidad and Tobago and percentage of population with at least 7th grade education in the United States with a correlation coefficient (R) of 0.265 and weighted average of 95.1%, a difference of 0.72%.
7th Grade Correlation Summary
| Measurement | Sri Lankan | Immigrants from Trinidad and Tobago |
| Minimum | 71.3% | 86.7% |
| Maximum | 100.0% | 100.0% |
| Range | 28.7% | 13.3% |
| Mean | 91.2% | 95.9% |
| Median | 92.2% | 95.9% |
| Interquartile 25% (IQ1) | 87.4% | 94.9% |
| Interquartile 75% (IQ3) | 95.5% | 97.1% |
| Interquartile Range (IQR) | 8.1% | 2.2% |
| Standard Deviation (Sample) | 6.2% | 2.2% |
| Standard Deviation (Population) | 6.2% | 2.2% |
Similar Demographics by 7th Grade
Demographics Similar to Sri Lankans by 7th Grade
In terms of 7th grade, the demographic groups most similar to Sri Lankans are Immigrants from Haiti (94.3%, a difference of 0.030%), Guyanese (94.3%, a difference of 0.060%), Immigrants from Laos (94.5%, a difference of 0.080%), Immigrants from Dominica (94.5%, a difference of 0.090%), and Immigrants from Burma/Myanmar (94.5%, a difference of 0.12%).
| Demographics | Rating | Rank | 7th Grade |
| Cubans | 0.0 /100 | #296 | Tragic 94.6% |
| Immigrants | South Eastern Asia | 0.0 /100 | #297 | Tragic 94.5% |
| Indonesians | 0.0 /100 | #298 | Tragic 94.5% |
| Bangladeshis | 0.0 /100 | #299 | Tragic 94.5% |
| Immigrants | Burma/Myanmar | 0.0 /100 | #300 | Tragic 94.5% |
| Immigrants | Dominica | 0.0 /100 | #301 | Tragic 94.5% |
| Immigrants | Laos | 0.0 /100 | #302 | Tragic 94.5% |
| Sri Lankans | 0.0 /100 | #303 | Tragic 94.4% |
| Immigrants | Haiti | 0.0 /100 | #304 | Tragic 94.3% |
| Guyanese | 0.0 /100 | #305 | Tragic 94.3% |
| Immigrants | Guyana | 0.0 /100 | #306 | Tragic 94.2% |
| Immigrants | Portugal | 0.0 /100 | #307 | Tragic 94.2% |
| Cape Verdeans | 0.0 /100 | #308 | Tragic 94.1% |
| Ecuadorians | 0.0 /100 | #309 | Tragic 94.0% |
| Immigrants | Caribbean | 0.0 /100 | #310 | Tragic 94.0% |
Demographics Similar to Immigrants from Trinidad and Tobago by 7th Grade
In terms of 7th grade, the demographic groups most similar to Immigrants from Trinidad and Tobago are Barbadian (95.1%, a difference of 0.010%), Immigrants from Afghanistan (95.1%, a difference of 0.030%), Immigrants from St. Vincent and the Grenadines (95.0%, a difference of 0.030%), Tohono O'odham (95.0%, a difference of 0.040%), and Immigrants from Thailand (95.1%, a difference of 0.050%).
| Demographics | Rating | Rank | 7th Grade |
| Immigrants | South America | 0.2 /100 | #271 | Tragic 95.1% |
| Peruvians | 0.2 /100 | #272 | Tragic 95.1% |
| Immigrants | Uzbekistan | 0.2 /100 | #273 | Tragic 95.1% |
| Immigrants | Western Africa | 0.2 /100 | #274 | Tragic 95.1% |
| Immigrants | Colombia | 0.2 /100 | #275 | Tragic 95.1% |
| Immigrants | Thailand | 0.2 /100 | #276 | Tragic 95.1% |
| Immigrants | Afghanistan | 0.2 /100 | #277 | Tragic 95.1% |
| Immigrants | Trinidad and Tobago | 0.1 /100 | #278 | Tragic 95.1% |
| Barbadians | 0.1 /100 | #279 | Tragic 95.1% |
| Immigrants | St. Vincent and the Grenadines | 0.1 /100 | #280 | Tragic 95.0% |
| Tohono O'odham | 0.1 /100 | #281 | Tragic 95.0% |
| Immigrants | Bolivia | 0.1 /100 | #282 | Tragic 95.0% |
| Immigrants | Barbados | 0.1 /100 | #283 | Tragic 95.0% |
| Armenians | 0.1 /100 | #284 | Tragic 95.0% |
| Immigrants | Eritrea | 0.1 /100 | #285 | Tragic 94.9% |