Uruguayan vs Houma 7th Grade
COMPARE
Uruguayan
Houma
7th Grade
7th Grade Comparison
Uruguayans
Houma
95.4%
7TH GRADE
1.6/ 100
METRIC RATING
244th/ 347
METRIC RANK
95.1%
7TH GRADE
0.2/ 100
METRIC RATING
270th/ 347
METRIC RANK
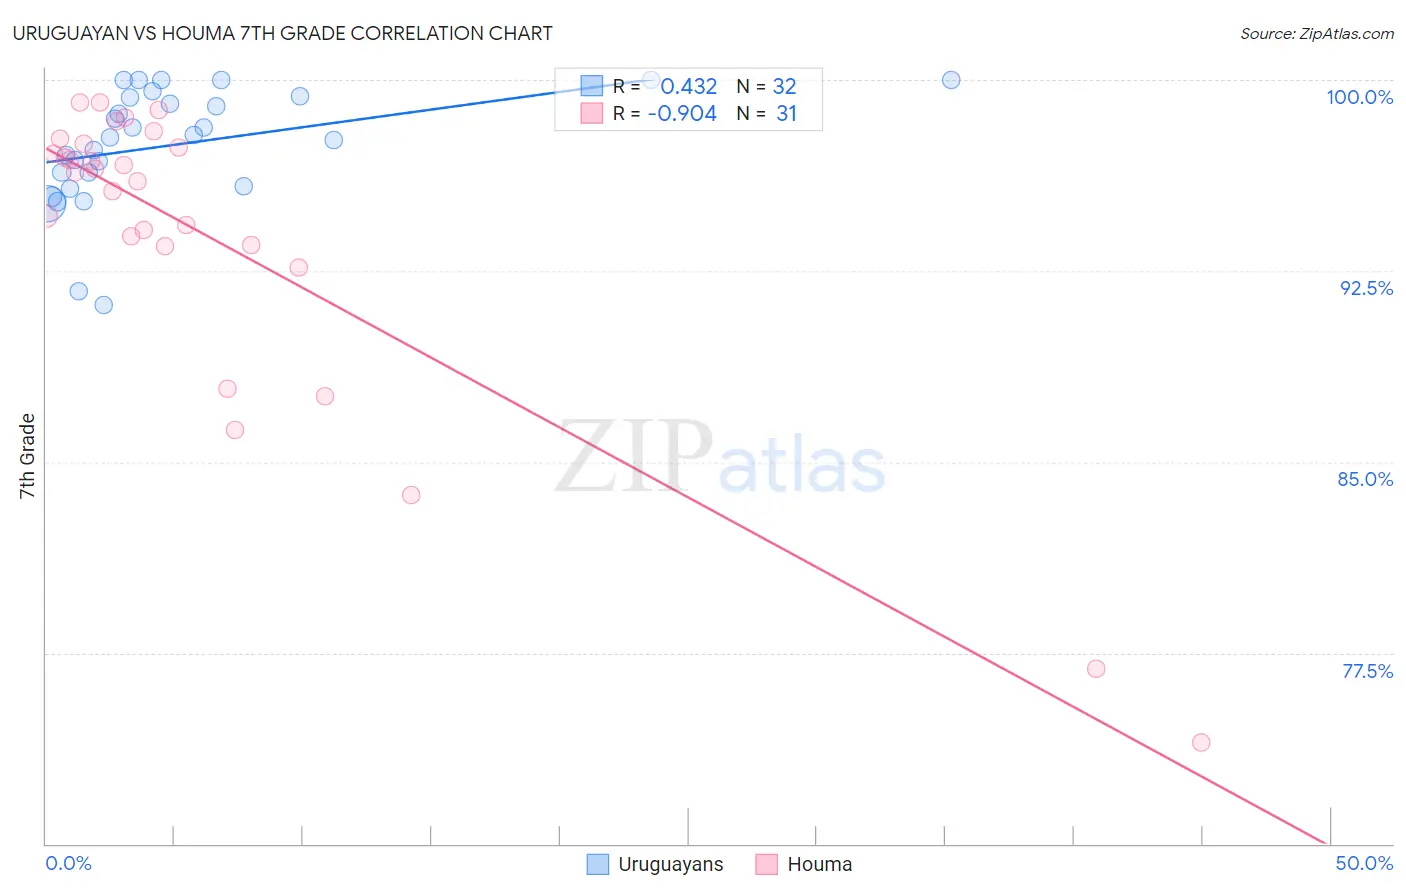
Uruguayan vs Houma 7th Grade Correlation Chart
The statistical analysis conducted on geographies consisting of 144,782,794 people shows a moderate positive correlation between the proportion of Uruguayans and percentage of population with at least 7th grade education in the United States with a correlation coefficient (R) of 0.432 and weighted average of 95.4%. Similarly, the statistical analysis conducted on geographies consisting of 36,795,916 people shows a near-perfect negative correlation between the proportion of Houma and percentage of population with at least 7th grade education in the United States with a correlation coefficient (R) of -0.904 and weighted average of 95.1%, a difference of 0.31%.
7th Grade Correlation Summary
| Measurement | Uruguayan | Houma |
| Minimum | 91.2% | 74.0% |
| Maximum | 100.0% | 99.1% |
| Range | 8.8% | 25.2% |
| Mean | 97.5% | 93.8% |
| Median | 97.8% | 96.4% |
| Interquartile 25% (IQ1) | 96.1% | 93.5% |
| Interquartile 75% (IQ3) | 99.3% | 97.5% |
| Interquartile Range (IQR) | 3.3% | 4.0% |
| Standard Deviation (Sample) | 2.3% | 6.2% |
| Standard Deviation (Population) | 2.2% | 6.1% |
Similar Demographics by 7th Grade
Demographics Similar to Uruguayans by 7th Grade
In terms of 7th grade, the demographic groups most similar to Uruguayans are U.S. Virgin Islander (95.4%, a difference of 0.0%), Immigrants from Middle Africa (95.4%, a difference of 0.010%), Ethiopian (95.4%, a difference of 0.010%), Immigrants from Sierra Leone (95.5%, a difference of 0.030%), and South American Indian (95.5%, a difference of 0.030%).
| Demographics | Rating | Rank | 7th Grade |
| Immigrants | Asia | 2.3 /100 | #237 | Tragic 95.5% |
| Indians (Asian) | 2.3 /100 | #238 | Tragic 95.5% |
| Jamaicans | 2.2 /100 | #239 | Tragic 95.5% |
| Immigrants | Sierra Leone | 2.0 /100 | #240 | Tragic 95.5% |
| South American Indians | 2.0 /100 | #241 | Tragic 95.5% |
| Immigrants | Senegal | 1.9 /100 | #242 | Tragic 95.5% |
| U.S. Virgin Islanders | 1.6 /100 | #243 | Tragic 95.4% |
| Uruguayans | 1.6 /100 | #244 | Tragic 95.4% |
| Immigrants | Middle Africa | 1.5 /100 | #245 | Tragic 95.4% |
| Ethiopians | 1.5 /100 | #246 | Tragic 95.4% |
| Tongans | 1.3 /100 | #247 | Tragic 95.4% |
| Paiute | 1.2 /100 | #248 | Tragic 95.4% |
| Bolivians | 1.1 /100 | #249 | Tragic 95.4% |
| Immigrants | Cameroon | 0.9 /100 | #250 | Tragic 95.4% |
| Immigrants | Jamaica | 0.9 /100 | #251 | Tragic 95.4% |
Demographics Similar to Houma by 7th Grade
In terms of 7th grade, the demographic groups most similar to Houma are Immigrants from South America (95.1%, a difference of 0.0%), Peruvian (95.1%, a difference of 0.0%), Immigrants from Uzbekistan (95.1%, a difference of 0.010%), Immigrants from Western Africa (95.1%, a difference of 0.010%), and Trinidadian and Tobagonian (95.2%, a difference of 0.020%).
| Demographics | Rating | Rank | 7th Grade |
| West Indians | 0.5 /100 | #263 | Tragic 95.2% |
| Immigrants | Nigeria | 0.4 /100 | #264 | Tragic 95.2% |
| Immigrants | Uruguay | 0.3 /100 | #265 | Tragic 95.2% |
| Immigrants | Ghana | 0.3 /100 | #266 | Tragic 95.2% |
| Yuman | 0.3 /100 | #267 | Tragic 95.2% |
| Immigrants | Hong Kong | 0.3 /100 | #268 | Tragic 95.2% |
| Trinidadians and Tobagonians | 0.3 /100 | #269 | Tragic 95.2% |
| Houma | 0.2 /100 | #270 | Tragic 95.1% |
| Immigrants | South America | 0.2 /100 | #271 | Tragic 95.1% |
| Peruvians | 0.2 /100 | #272 | Tragic 95.1% |
| Immigrants | Uzbekistan | 0.2 /100 | #273 | Tragic 95.1% |
| Immigrants | Western Africa | 0.2 /100 | #274 | Tragic 95.1% |
| Immigrants | Colombia | 0.2 /100 | #275 | Tragic 95.1% |
| Immigrants | Thailand | 0.2 /100 | #276 | Tragic 95.1% |
| Immigrants | Afghanistan | 0.2 /100 | #277 | Tragic 95.1% |