Choctaw vs Immigrants from Lithuania Master's Degree
COMPARE
Choctaw
Immigrants from Lithuania
Master's Degree
Master's Degree Comparison
Choctaw
Immigrants from Lithuania
11.0%
MASTER'S DEGREE
0.0/ 100
METRIC RATING
312th/ 347
METRIC RANK
18.5%
MASTER'S DEGREE
99.9/ 100
METRIC RATING
54th/ 347
METRIC RANK
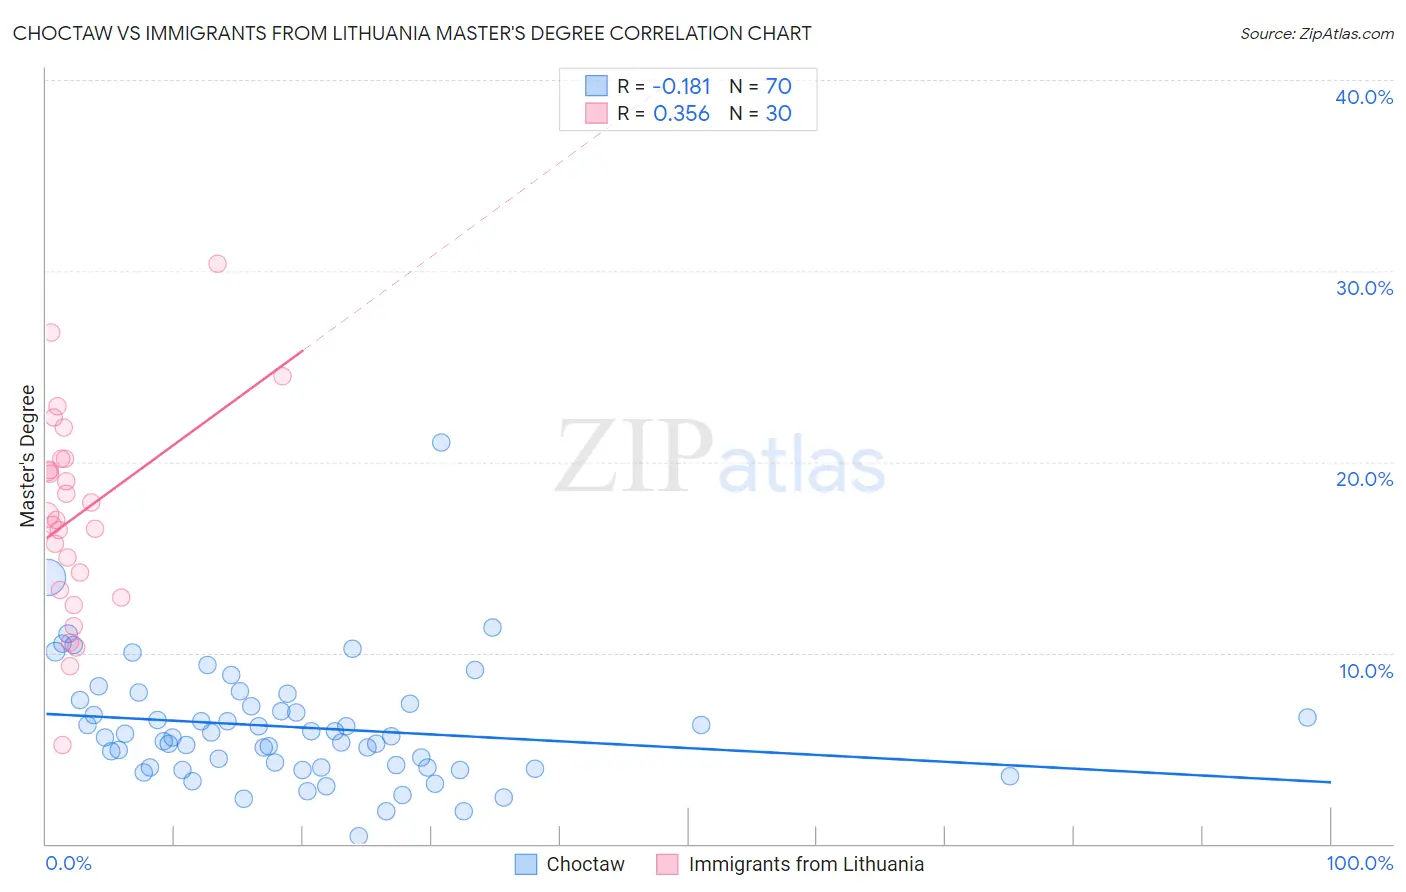
Choctaw vs Immigrants from Lithuania Master's Degree Correlation Chart
The statistical analysis conducted on geographies consisting of 269,630,236 people shows a poor negative correlation between the proportion of Choctaw and percentage of population with at least master's degree education in the United States with a correlation coefficient (R) of -0.181 and weighted average of 11.0%. Similarly, the statistical analysis conducted on geographies consisting of 117,722,731 people shows a mild positive correlation between the proportion of Immigrants from Lithuania and percentage of population with at least master's degree education in the United States with a correlation coefficient (R) of 0.356 and weighted average of 18.5%, a difference of 67.6%.
Master's Degree Correlation Summary
| Measurement | Choctaw | Immigrants from Lithuania |
| Minimum | 0.41% | 5.1% |
| Maximum | 21.0% | 30.4% |
| Range | 20.6% | 25.3% |
| Mean | 6.1% | 17.2% |
| Median | 5.6% | 17.1% |
| Interquartile 25% (IQ1) | 4.0% | 13.3% |
| Interquartile 75% (IQ3) | 7.3% | 20.1% |
| Interquartile Range (IQR) | 3.3% | 6.8% |
| Standard Deviation (Sample) | 3.2% | 5.4% |
| Standard Deviation (Population) | 3.1% | 5.3% |
Similar Demographics by Master's Degree
Demographics Similar to Choctaw by Master's Degree
In terms of master's degree, the demographic groups most similar to Choctaw are Seminole (11.0%, a difference of 0.10%), Yaqui (11.0%, a difference of 0.18%), Cajun (11.0%, a difference of 0.57%), Apache (11.0%, a difference of 0.58%), and Shoshone (11.1%, a difference of 0.61%).
| Demographics | Rating | Rank | Master's Degree |
| Immigrants | Latin America | 0.0 /100 | #305 | Tragic 11.3% |
| Mexican American Indians | 0.0 /100 | #306 | Tragic 11.2% |
| Cheyenne | 0.0 /100 | #307 | Tragic 11.2% |
| Puerto Ricans | 0.0 /100 | #308 | Tragic 11.2% |
| Puget Sound Salish | 0.0 /100 | #309 | Tragic 11.1% |
| Shoshone | 0.0 /100 | #310 | Tragic 11.1% |
| Seminole | 0.0 /100 | #311 | Tragic 11.0% |
| Choctaw | 0.0 /100 | #312 | Tragic 11.0% |
| Yaqui | 0.0 /100 | #313 | Tragic 11.0% |
| Cajuns | 0.0 /100 | #314 | Tragic 11.0% |
| Apache | 0.0 /100 | #315 | Tragic 11.0% |
| Hispanics or Latinos | 0.0 /100 | #316 | Tragic 10.9% |
| Hopi | 0.0 /100 | #317 | Tragic 10.9% |
| Immigrants | Cuba | 0.0 /100 | #318 | Tragic 10.9% |
| Kiowa | 0.0 /100 | #319 | Tragic 10.8% |
Demographics Similar to Immigrants from Lithuania by Master's Degree
In terms of master's degree, the demographic groups most similar to Immigrants from Lithuania are Immigrants from Serbia (18.5%, a difference of 0.030%), Asian (18.4%, a difference of 0.26%), Immigrants from Czechoslovakia (18.5%, a difference of 0.31%), Immigrants from Kuwait (18.6%, a difference of 0.39%), and Immigrants from Asia (18.4%, a difference of 0.39%).
| Demographics | Rating | Rank | Master's Degree |
| Immigrants | Austria | 100.0 /100 | #47 | Exceptional 18.8% |
| Paraguayans | 100.0 /100 | #48 | Exceptional 18.8% |
| Estonians | 100.0 /100 | #49 | Exceptional 18.8% |
| Bulgarians | 100.0 /100 | #50 | Exceptional 18.8% |
| Immigrants | South Africa | 100.0 /100 | #51 | Exceptional 18.8% |
| Immigrants | Kuwait | 100.0 /100 | #52 | Exceptional 18.6% |
| Immigrants | Czechoslovakia | 99.9 /100 | #53 | Exceptional 18.5% |
| Immigrants | Lithuania | 99.9 /100 | #54 | Exceptional 18.5% |
| Immigrants | Serbia | 99.9 /100 | #55 | Exceptional 18.5% |
| Asians | 99.9 /100 | #56 | Exceptional 18.4% |
| Immigrants | Asia | 99.9 /100 | #57 | Exceptional 18.4% |
| Australians | 99.9 /100 | #58 | Exceptional 18.4% |
| Immigrants | Bulgaria | 99.9 /100 | #59 | Exceptional 18.3% |
| New Zealanders | 99.9 /100 | #60 | Exceptional 18.3% |
| Immigrants | Europe | 99.9 /100 | #61 | Exceptional 18.2% |