Immigrants from Eastern Europe vs Finnish College, 1 year or more
COMPARE
Immigrants from Eastern Europe
Finnish
College, 1 year or more
College, 1 year or more Comparison
Immigrants from Eastern Europe
Finns
62.4%
COLLEGE, 1 YEAR OR MORE
97.8/ 100
METRIC RATING
91st/ 347
METRIC RANK
60.2%
COLLEGE, 1 YEAR OR MORE
72.9/ 100
METRIC RATING
156th/ 347
METRIC RANK
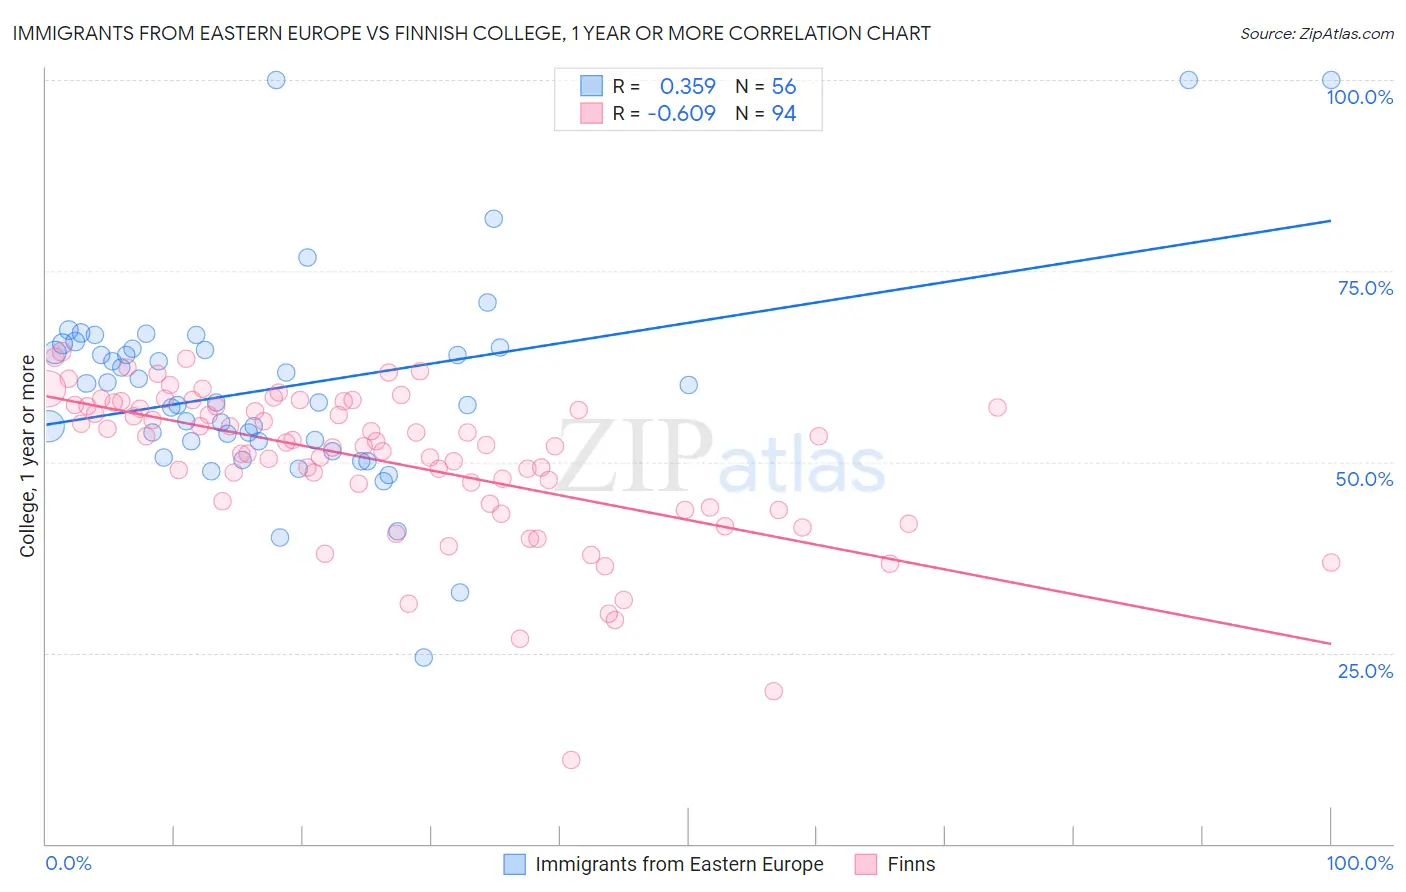
Immigrants from Eastern Europe vs Finnish College, 1 year or more Correlation Chart
The statistical analysis conducted on geographies consisting of 475,874,060 people shows a mild positive correlation between the proportion of Immigrants from Eastern Europe and percentage of population with at least college, 1 year or more education in the United States with a correlation coefficient (R) of 0.359 and weighted average of 62.4%. Similarly, the statistical analysis conducted on geographies consisting of 404,673,514 people shows a significant negative correlation between the proportion of Finns and percentage of population with at least college, 1 year or more education in the United States with a correlation coefficient (R) of -0.609 and weighted average of 60.2%, a difference of 3.7%.
College, 1 year or more Correlation Summary
| Measurement | Immigrants from Eastern Europe | Finnish |
| Minimum | 24.4% | 11.0% |
| Maximum | 100.0% | 64.4% |
| Range | 75.6% | 53.4% |
| Mean | 59.8% | 50.1% |
| Median | 58.9% | 52.3% |
| Interquartile 25% (IQ1) | 52.7% | 44.5% |
| Interquartile 75% (IQ3) | 64.9% | 57.3% |
| Interquartile Range (IQR) | 12.2% | 12.8% |
| Standard Deviation (Sample) | 13.7% | 10.0% |
| Standard Deviation (Population) | 13.6% | 9.9% |
Similar Demographics by College, 1 year or more
Demographics Similar to Immigrants from Eastern Europe by College, 1 year or more
In terms of college, 1 year or more, the demographic groups most similar to Immigrants from Eastern Europe are Immigrants from Egypt (62.4%, a difference of 0.010%), Romanian (62.4%, a difference of 0.040%), Immigrants from Croatia (62.3%, a difference of 0.090%), Immigrants from Western Asia (62.5%, a difference of 0.10%), and British (62.3%, a difference of 0.20%).
| Demographics | Rating | Rank | College, 1 year or more |
| Immigrants | England | 98.6 /100 | #84 | Exceptional 62.8% |
| Immigrants | Pakistan | 98.6 /100 | #85 | Exceptional 62.8% |
| Immigrants | Western Europe | 98.6 /100 | #86 | Exceptional 62.7% |
| Immigrants | Hungary | 98.6 /100 | #87 | Exceptional 62.7% |
| Greeks | 98.3 /100 | #88 | Exceptional 62.6% |
| Immigrants | Ethiopia | 98.2 /100 | #89 | Exceptional 62.6% |
| Immigrants | Western Asia | 97.9 /100 | #90 | Exceptional 62.5% |
| Immigrants | Eastern Europe | 97.8 /100 | #91 | Exceptional 62.4% |
| Immigrants | Egypt | 97.8 /100 | #92 | Exceptional 62.4% |
| Romanians | 97.7 /100 | #93 | Exceptional 62.4% |
| Immigrants | Croatia | 97.6 /100 | #94 | Exceptional 62.3% |
| British | 97.4 /100 | #95 | Exceptional 62.3% |
| Chinese | 97.2 /100 | #96 | Exceptional 62.2% |
| Jordanians | 97.2 /100 | #97 | Exceptional 62.2% |
| Carpatho Rusyns | 97.2 /100 | #98 | Exceptional 62.2% |
Demographics Similar to Finns by College, 1 year or more
In terms of college, 1 year or more, the demographic groups most similar to Finns are Sudanese (60.2%, a difference of 0.0%), Moroccan (60.2%, a difference of 0.0%), Sierra Leonean (60.2%, a difference of 0.080%), Immigrants from Germany (60.3%, a difference of 0.22%), and Immigrants from Armenia (60.0%, a difference of 0.26%).
| Demographics | Rating | Rank | College, 1 year or more |
| Brazilians | 79.0 /100 | #149 | Good 60.5% |
| Immigrants | Sudan | 77.8 /100 | #150 | Good 60.4% |
| Albanians | 77.8 /100 | #151 | Good 60.4% |
| Immigrants | Germany | 76.1 /100 | #152 | Good 60.3% |
| Sierra Leoneans | 74.1 /100 | #153 | Good 60.2% |
| Sudanese | 73.0 /100 | #154 | Good 60.2% |
| Moroccans | 72.9 /100 | #155 | Good 60.2% |
| Finns | 72.9 /100 | #156 | Good 60.2% |
| Immigrants | Armenia | 68.8 /100 | #157 | Good 60.0% |
| English | 67.2 /100 | #158 | Good 60.0% |
| Immigrants | Iraq | 67.0 /100 | #159 | Good 60.0% |
| South American Indians | 66.9 /100 | #160 | Good 60.0% |
| Somalis | 64.5 /100 | #161 | Good 59.9% |
| Koreans | 58.5 /100 | #162 | Average 59.7% |
| Immigrants | Somalia | 58.3 /100 | #163 | Average 59.7% |