Haitian vs Comanche Master's Degree
COMPARE
Haitian
Comanche
Master's Degree
Master's Degree Comparison
Haitians
Comanche
12.1%
MASTER'S DEGREE
0.3/ 100
METRIC RATING
271st/ 347
METRIC RANK
12.1%
MASTER'S DEGREE
0.3/ 100
METRIC RATING
272nd/ 347
METRIC RANK
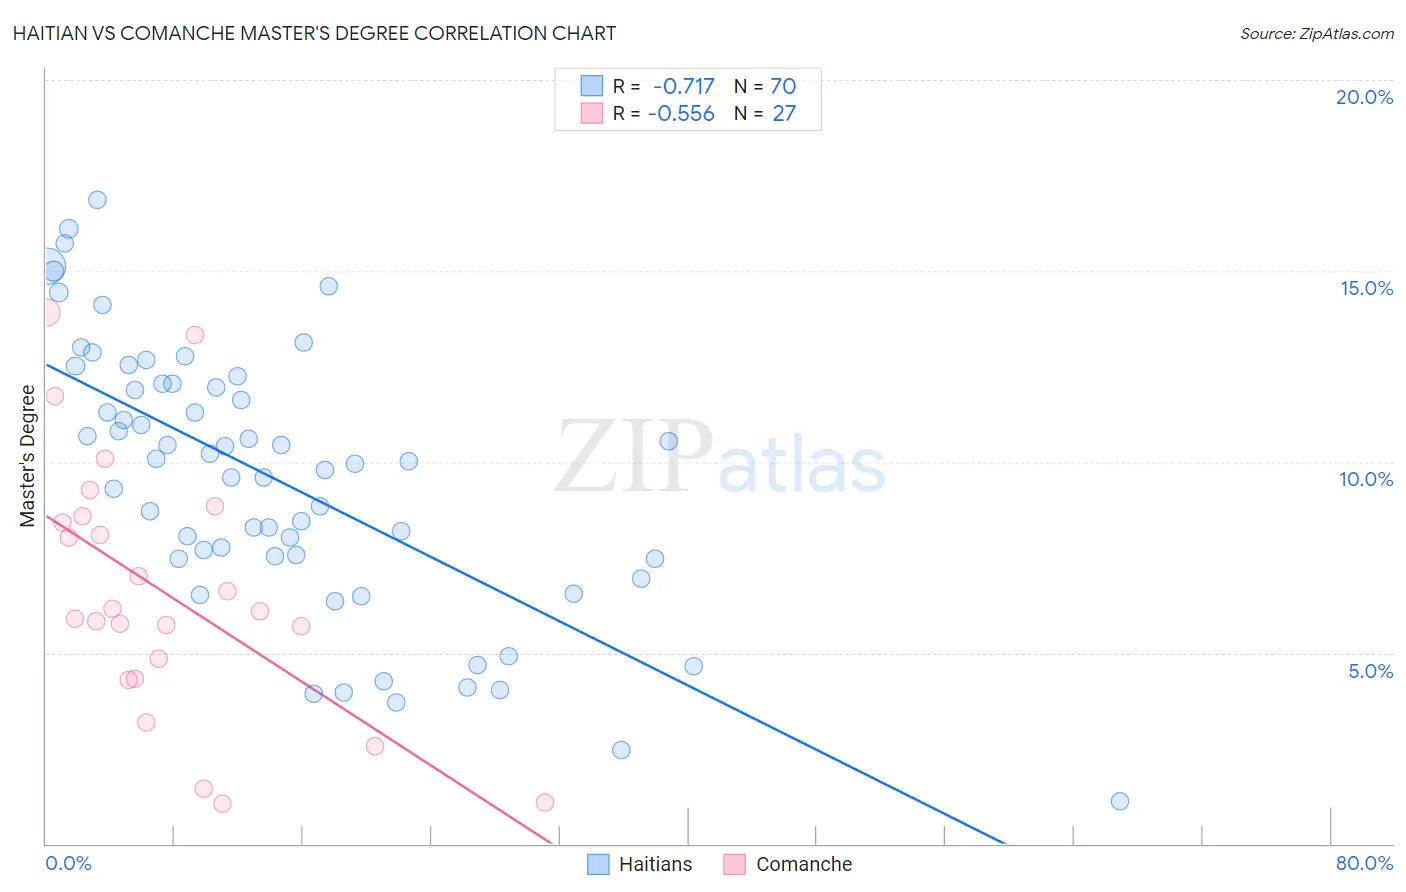
Haitian vs Comanche Master's Degree Correlation Chart
The statistical analysis conducted on geographies consisting of 287,849,817 people shows a strong negative correlation between the proportion of Haitians and percentage of population with at least master's degree education in the United States with a correlation coefficient (R) of -0.717 and weighted average of 12.1%. Similarly, the statistical analysis conducted on geographies consisting of 109,770,893 people shows a substantial negative correlation between the proportion of Comanche and percentage of population with at least master's degree education in the United States with a correlation coefficient (R) of -0.556 and weighted average of 12.1%, a difference of 0.060%.
Master's Degree Correlation Summary
| Measurement | Haitian | Comanche |
| Minimum | 1.1% | 1.0% |
| Maximum | 16.9% | 13.9% |
| Range | 15.8% | 12.9% |
| Mean | 9.5% | 6.6% |
| Median | 10.0% | 6.1% |
| Interquartile 25% (IQ1) | 7.5% | 4.3% |
| Interquartile 75% (IQ3) | 12.0% | 8.6% |
| Interquartile Range (IQR) | 4.6% | 4.3% |
| Standard Deviation (Sample) | 3.5% | 3.4% |
| Standard Deviation (Population) | 3.5% | 3.3% |
Demographics Similar to Haitians and Comanche by Master's Degree
In terms of master's degree, the demographic groups most similar to Haitians are Blackfeet (12.1%, a difference of 0.15%), Cape Verdean (12.1%, a difference of 0.24%), Cuban (12.1%, a difference of 0.25%), Black/African American (12.1%, a difference of 0.31%), and Immigrants from Caribbean (12.1%, a difference of 0.32%). Similarly, the demographic groups most similar to Comanche are Blackfeet (12.1%, a difference of 0.090%), Cape Verdean (12.1%, a difference of 0.18%), Cuban (12.1%, a difference of 0.20%), Black/African American (12.1%, a difference of 0.25%), and Immigrants from Caribbean (12.1%, a difference of 0.26%).
| Demographics | Rating | Rank | Master's Degree |
| Tongans | 0.6 /100 | #261 | Tragic 12.5% |
| Nicaraguans | 0.6 /100 | #262 | Tragic 12.5% |
| Central American Indians | 0.5 /100 | #263 | Tragic 12.4% |
| Belizeans | 0.5 /100 | #264 | Tragic 12.4% |
| Immigrants | Fiji | 0.5 /100 | #265 | Tragic 12.4% |
| Bahamians | 0.5 /100 | #266 | Tragic 12.4% |
| Americans | 0.4 /100 | #267 | Tragic 12.3% |
| Native Hawaiians | 0.4 /100 | #268 | Tragic 12.3% |
| Central Americans | 0.3 /100 | #269 | Tragic 12.2% |
| Salvadorans | 0.3 /100 | #270 | Tragic 12.2% |
| Haitians | 0.3 /100 | #271 | Tragic 12.1% |
| Comanche | 0.3 /100 | #272 | Tragic 12.1% |
| Blackfeet | 0.3 /100 | #273 | Tragic 12.1% |
| Cape Verdeans | 0.3 /100 | #274 | Tragic 12.1% |
| Cubans | 0.3 /100 | #275 | Tragic 12.1% |
| Blacks/African Americans | 0.3 /100 | #276 | Tragic 12.1% |
| Immigrants | Caribbean | 0.3 /100 | #277 | Tragic 12.1% |
| Potawatomi | 0.3 /100 | #278 | Tragic 12.1% |
| Immigrants | Belize | 0.2 /100 | #279 | Tragic 12.1% |
| Immigrants | Dominican Republic | 0.2 /100 | #280 | Tragic 12.1% |
| Malaysians | 0.2 /100 | #281 | Tragic 12.0% |