Egyptian vs Comanche Master's Degree
COMPARE
Egyptian
Comanche
Master's Degree
Master's Degree Comparison
Egyptians
Comanche
17.6%
MASTER'S DEGREE
99.6/ 100
METRIC RATING
75th/ 347
METRIC RANK
12.1%
MASTER'S DEGREE
0.3/ 100
METRIC RATING
272nd/ 347
METRIC RANK
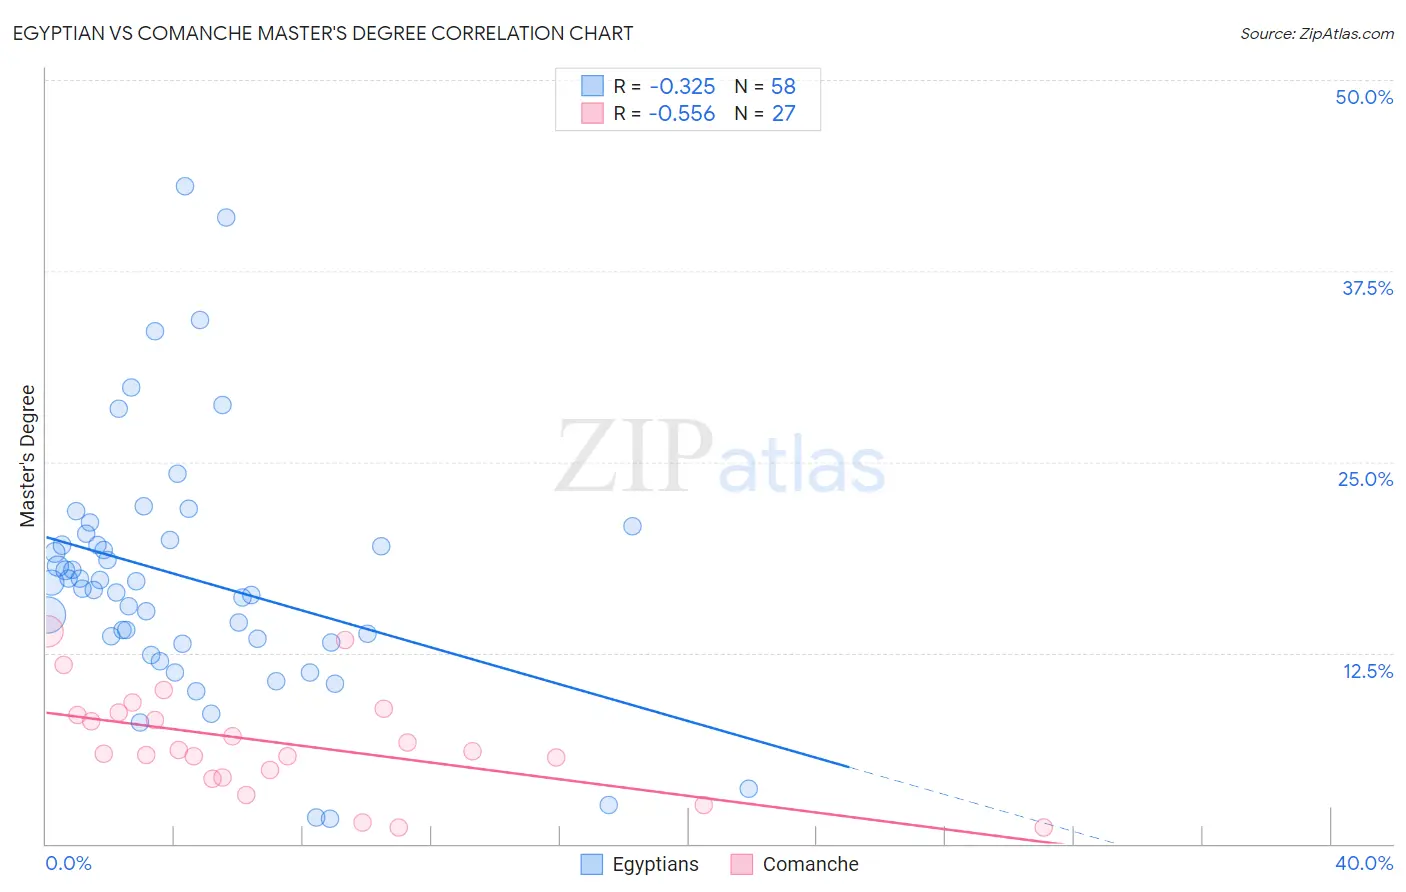
Egyptian vs Comanche Master's Degree Correlation Chart
The statistical analysis conducted on geographies consisting of 276,863,578 people shows a mild negative correlation between the proportion of Egyptians and percentage of population with at least master's degree education in the United States with a correlation coefficient (R) of -0.325 and weighted average of 17.6%. Similarly, the statistical analysis conducted on geographies consisting of 109,770,893 people shows a substantial negative correlation between the proportion of Comanche and percentage of population with at least master's degree education in the United States with a correlation coefficient (R) of -0.556 and weighted average of 12.1%, a difference of 45.5%.
Master's Degree Correlation Summary
| Measurement | Egyptian | Comanche |
| Minimum | 1.6% | 1.0% |
| Maximum | 43.1% | 13.9% |
| Range | 41.4% | 12.9% |
| Mean | 17.4% | 6.6% |
| Median | 16.9% | 6.1% |
| Interquartile 25% (IQ1) | 13.2% | 4.3% |
| Interquartile 75% (IQ3) | 19.9% | 8.6% |
| Interquartile Range (IQR) | 6.7% | 4.3% |
| Standard Deviation (Sample) | 8.2% | 3.4% |
| Standard Deviation (Population) | 8.1% | 3.3% |
Similar Demographics by Master's Degree
Demographics Similar to Egyptians by Master's Degree
In terms of master's degree, the demographic groups most similar to Egyptians are Immigrants from Indonesia (17.6%, a difference of 0.030%), Immigrants from Eastern Europe (17.6%, a difference of 0.14%), Immigrants from Hungary (17.5%, a difference of 0.34%), Immigrants from Romania (17.7%, a difference of 0.38%), and Immigrants from Lebanon (17.5%, a difference of 0.47%).
| Demographics | Rating | Rank | Master's Degree |
| Immigrants | Ethiopia | 99.8 /100 | #68 | Exceptional 17.9% |
| Immigrants | Uzbekistan | 99.8 /100 | #69 | Exceptional 17.9% |
| Immigrants | Western Europe | 99.8 /100 | #70 | Exceptional 17.8% |
| Immigrants | Pakistan | 99.7 /100 | #71 | Exceptional 17.8% |
| Lithuanians | 99.7 /100 | #72 | Exceptional 17.7% |
| Zimbabweans | 99.7 /100 | #73 | Exceptional 17.7% |
| Immigrants | Romania | 99.7 /100 | #74 | Exceptional 17.7% |
| Egyptians | 99.6 /100 | #75 | Exceptional 17.6% |
| Immigrants | Indonesia | 99.6 /100 | #76 | Exceptional 17.6% |
| Immigrants | Eastern Europe | 99.6 /100 | #77 | Exceptional 17.6% |
| Immigrants | Hungary | 99.6 /100 | #78 | Exceptional 17.5% |
| Immigrants | Lebanon | 99.6 /100 | #79 | Exceptional 17.5% |
| Carpatho Rusyns | 99.6 /100 | #80 | Exceptional 17.5% |
| Immigrants | Western Asia | 99.5 /100 | #81 | Exceptional 17.5% |
| Greeks | 99.5 /100 | #82 | Exceptional 17.5% |
Demographics Similar to Comanche by Master's Degree
In terms of master's degree, the demographic groups most similar to Comanche are Haitian (12.1%, a difference of 0.060%), Blackfeet (12.1%, a difference of 0.090%), Cape Verdean (12.1%, a difference of 0.18%), Cuban (12.1%, a difference of 0.20%), and Black/African American (12.1%, a difference of 0.25%).
| Demographics | Rating | Rank | Master's Degree |
| Immigrants | Fiji | 0.5 /100 | #265 | Tragic 12.4% |
| Bahamians | 0.5 /100 | #266 | Tragic 12.4% |
| Americans | 0.4 /100 | #267 | Tragic 12.3% |
| Native Hawaiians | 0.4 /100 | #268 | Tragic 12.3% |
| Central Americans | 0.3 /100 | #269 | Tragic 12.2% |
| Salvadorans | 0.3 /100 | #270 | Tragic 12.2% |
| Haitians | 0.3 /100 | #271 | Tragic 12.1% |
| Comanche | 0.3 /100 | #272 | Tragic 12.1% |
| Blackfeet | 0.3 /100 | #273 | Tragic 12.1% |
| Cape Verdeans | 0.3 /100 | #274 | Tragic 12.1% |
| Cubans | 0.3 /100 | #275 | Tragic 12.1% |
| Blacks/African Americans | 0.3 /100 | #276 | Tragic 12.1% |
| Immigrants | Caribbean | 0.3 /100 | #277 | Tragic 12.1% |
| Potawatomi | 0.3 /100 | #278 | Tragic 12.1% |
| Immigrants | Belize | 0.2 /100 | #279 | Tragic 12.1% |