Turkish vs Central American 10th Grade
COMPARE
Turkish
Central American
10th Grade
10th Grade Comparison
Turks
Central Americans
95.0%
10TH GRADE
99.7/ 100
METRIC RATING
65th/ 347
METRIC RANK
88.4%
10TH GRADE
0.0/ 100
METRIC RATING
337th/ 347
METRIC RANK
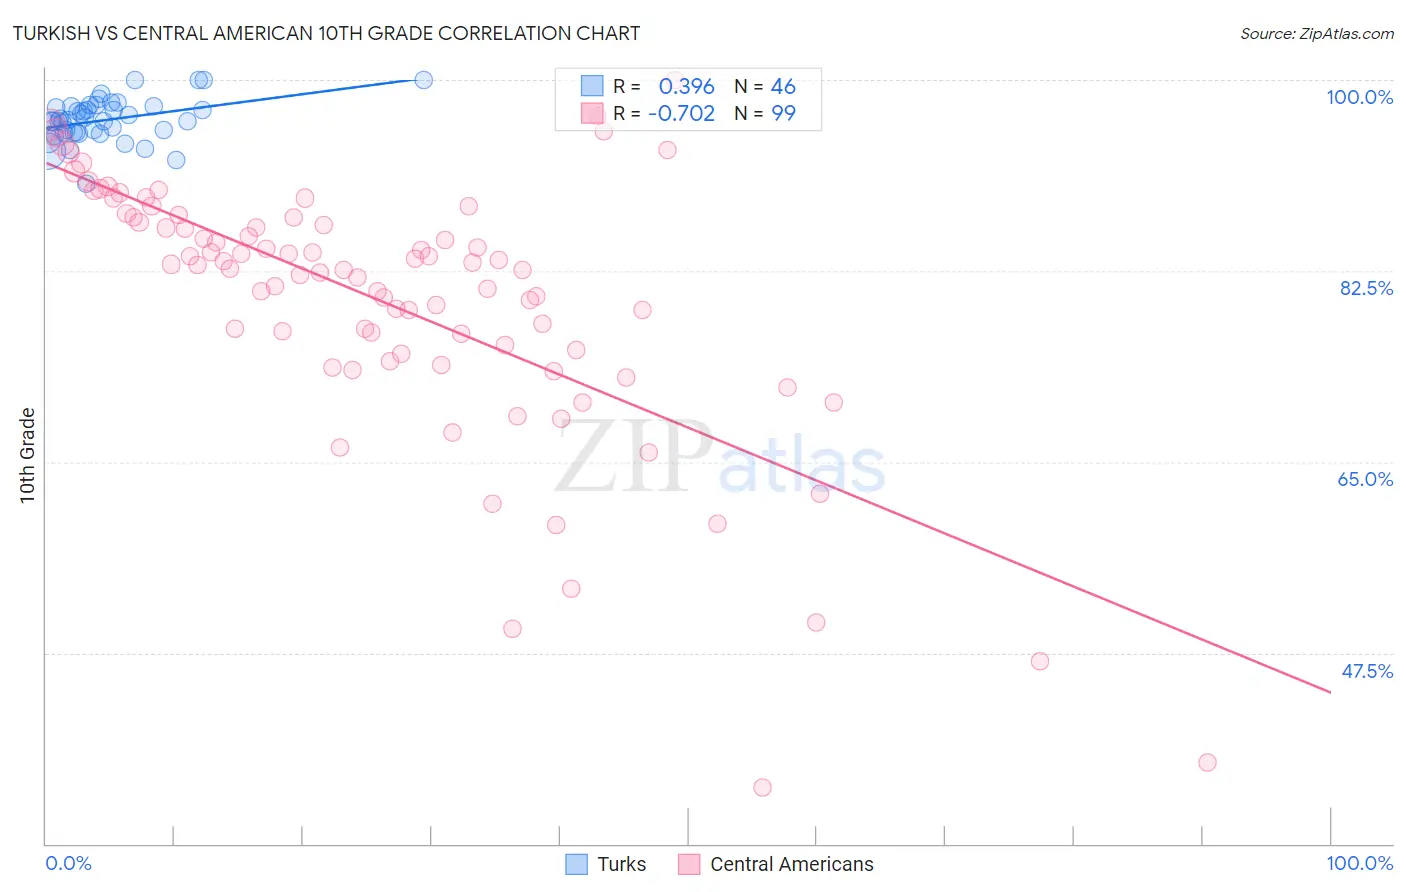
Turkish vs Central American 10th Grade Correlation Chart
The statistical analysis conducted on geographies consisting of 271,830,524 people shows a mild positive correlation between the proportion of Turks and percentage of population with at least 10th grade education in the United States with a correlation coefficient (R) of 0.396 and weighted average of 95.0%. Similarly, the statistical analysis conducted on geographies consisting of 504,619,347 people shows a strong negative correlation between the proportion of Central Americans and percentage of population with at least 10th grade education in the United States with a correlation coefficient (R) of -0.702 and weighted average of 88.4%, a difference of 7.4%.
10th Grade Correlation Summary
| Measurement | Turkish | Central American |
| Minimum | 90.5% | 35.2% |
| Maximum | 100.0% | 100.0% |
| Range | 9.5% | 64.8% |
| Mean | 96.4% | 79.6% |
| Median | 96.3% | 82.7% |
| Interquartile 25% (IQ1) | 95.2% | 74.9% |
| Interquartile 75% (IQ3) | 97.6% | 87.4% |
| Interquartile Range (IQR) | 2.4% | 12.6% |
| Standard Deviation (Sample) | 2.0% | 12.1% |
| Standard Deviation (Population) | 1.9% | 12.1% |
Similar Demographics by 10th Grade
Demographics Similar to Turks by 10th Grade
In terms of 10th grade, the demographic groups most similar to Turks are Native Hawaiian (95.0%, a difference of 0.010%), Immigrants from Singapore (95.0%, a difference of 0.020%), Cypriot (95.0%, a difference of 0.030%), Chippewa (95.0%, a difference of 0.030%), and Thai (95.0%, a difference of 0.030%).
| Demographics | Rating | Rank | 10th Grade |
| Aleuts | 99.8 /100 | #58 | Exceptional 95.0% |
| Celtics | 99.8 /100 | #59 | Exceptional 95.0% |
| Cypriots | 99.8 /100 | #60 | Exceptional 95.0% |
| Chippewa | 99.8 /100 | #61 | Exceptional 95.0% |
| Thais | 99.8 /100 | #62 | Exceptional 95.0% |
| Immigrants | Singapore | 99.8 /100 | #63 | Exceptional 95.0% |
| Native Hawaiians | 99.7 /100 | #64 | Exceptional 95.0% |
| Turks | 99.7 /100 | #65 | Exceptional 95.0% |
| Immigrants | Australia | 99.7 /100 | #66 | Exceptional 94.9% |
| Immigrants | Netherlands | 99.7 /100 | #67 | Exceptional 94.9% |
| Immigrants | Belgium | 99.7 /100 | #68 | Exceptional 94.9% |
| Immigrants | England | 99.6 /100 | #69 | Exceptional 94.9% |
| Zimbabweans | 99.6 /100 | #70 | Exceptional 94.9% |
| Alaska Natives | 99.6 /100 | #71 | Exceptional 94.9% |
| Immigrants | Sweden | 99.6 /100 | #72 | Exceptional 94.9% |
Demographics Similar to Central Americans by 10th Grade
In terms of 10th grade, the demographic groups most similar to Central Americans are Immigrants from Latin America (88.3%, a difference of 0.060%), Immigrants from Honduras (88.5%, a difference of 0.15%), Immigrants from Dominican Republic (88.7%, a difference of 0.35%), Hispanic or Latino (88.9%, a difference of 0.53%), and Guatemalan (87.9%, a difference of 0.56%).
| Demographics | Rating | Rank | 10th Grade |
| Immigrants | Yemen | 0.0 /100 | #330 | Tragic 89.1% |
| Mexican American Indians | 0.0 /100 | #331 | Tragic 89.0% |
| Immigrants | Azores | 0.0 /100 | #332 | Tragic 89.0% |
| Hondurans | 0.0 /100 | #333 | Tragic 89.0% |
| Hispanics or Latinos | 0.0 /100 | #334 | Tragic 88.9% |
| Immigrants | Dominican Republic | 0.0 /100 | #335 | Tragic 88.7% |
| Immigrants | Honduras | 0.0 /100 | #336 | Tragic 88.5% |
| Central Americans | 0.0 /100 | #337 | Tragic 88.4% |
| Immigrants | Latin America | 0.0 /100 | #338 | Tragic 88.3% |
| Guatemalans | 0.0 /100 | #339 | Tragic 87.9% |
| Mexicans | 0.0 /100 | #340 | Tragic 87.8% |
| Salvadorans | 0.0 /100 | #341 | Tragic 87.5% |
| Immigrants | Guatemala | 0.0 /100 | #342 | Tragic 87.4% |
| Yakama | 0.0 /100 | #343 | Tragic 86.9% |
| Immigrants | El Salvador | 0.0 /100 | #344 | Tragic 86.8% |