Turkish vs Immigrants from Congo 10th Grade
COMPARE
Turkish
Immigrants from Congo
10th Grade
10th Grade Comparison
Turks
Immigrants from Congo
95.0%
10TH GRADE
99.7/ 100
METRIC RATING
65th/ 347
METRIC RANK
92.4%
10TH GRADE
0.2/ 100
METRIC RATING
274th/ 347
METRIC RANK
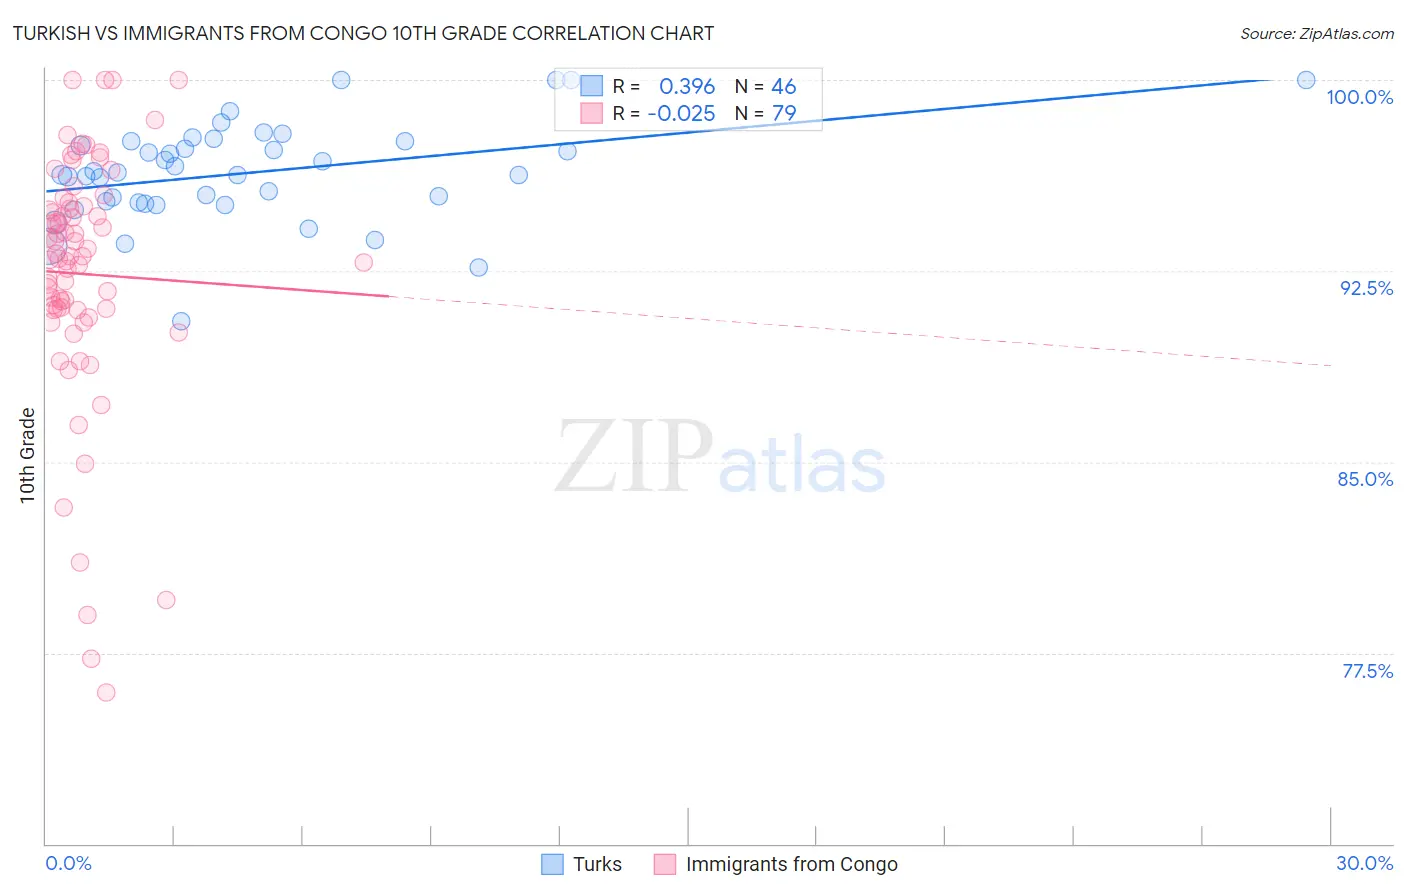
Turkish vs Immigrants from Congo 10th Grade Correlation Chart
The statistical analysis conducted on geographies consisting of 271,830,524 people shows a mild positive correlation between the proportion of Turks and percentage of population with at least 10th grade education in the United States with a correlation coefficient (R) of 0.396 and weighted average of 95.0%. Similarly, the statistical analysis conducted on geographies consisting of 92,131,505 people shows no correlation between the proportion of Immigrants from Congo and percentage of population with at least 10th grade education in the United States with a correlation coefficient (R) of -0.025 and weighted average of 92.4%, a difference of 2.7%.
10th Grade Correlation Summary
| Measurement | Turkish | Immigrants from Congo |
| Minimum | 90.5% | 75.9% |
| Maximum | 100.0% | 100.0% |
| Range | 9.5% | 24.1% |
| Mean | 96.4% | 92.4% |
| Median | 96.3% | 93.1% |
| Interquartile 25% (IQ1) | 95.2% | 91.0% |
| Interquartile 75% (IQ3) | 97.6% | 95.1% |
| Interquartile Range (IQR) | 2.4% | 4.1% |
| Standard Deviation (Sample) | 2.0% | 4.9% |
| Standard Deviation (Population) | 1.9% | 4.9% |
Similar Demographics by 10th Grade
Demographics Similar to Turks by 10th Grade
In terms of 10th grade, the demographic groups most similar to Turks are Native Hawaiian (95.0%, a difference of 0.010%), Immigrants from Singapore (95.0%, a difference of 0.020%), Cypriot (95.0%, a difference of 0.030%), Chippewa (95.0%, a difference of 0.030%), and Thai (95.0%, a difference of 0.030%).
| Demographics | Rating | Rank | 10th Grade |
| Aleuts | 99.8 /100 | #58 | Exceptional 95.0% |
| Celtics | 99.8 /100 | #59 | Exceptional 95.0% |
| Cypriots | 99.8 /100 | #60 | Exceptional 95.0% |
| Chippewa | 99.8 /100 | #61 | Exceptional 95.0% |
| Thais | 99.8 /100 | #62 | Exceptional 95.0% |
| Immigrants | Singapore | 99.8 /100 | #63 | Exceptional 95.0% |
| Native Hawaiians | 99.7 /100 | #64 | Exceptional 95.0% |
| Turks | 99.7 /100 | #65 | Exceptional 95.0% |
| Immigrants | Australia | 99.7 /100 | #66 | Exceptional 94.9% |
| Immigrants | Netherlands | 99.7 /100 | #67 | Exceptional 94.9% |
| Immigrants | Belgium | 99.7 /100 | #68 | Exceptional 94.9% |
| Immigrants | England | 99.6 /100 | #69 | Exceptional 94.9% |
| Zimbabweans | 99.6 /100 | #70 | Exceptional 94.9% |
| Alaska Natives | 99.6 /100 | #71 | Exceptional 94.9% |
| Immigrants | Sweden | 99.6 /100 | #72 | Exceptional 94.9% |
Demographics Similar to Immigrants from Congo by 10th Grade
In terms of 10th grade, the demographic groups most similar to Immigrants from Congo are West Indian (92.4%, a difference of 0.0%), Trinidadian and Tobagonian (92.4%, a difference of 0.010%), Immigrants from Western Africa (92.5%, a difference of 0.080%), Immigrants from Eritrea (92.5%, a difference of 0.090%), and Immigrants from Colombia (92.5%, a difference of 0.10%).
| Demographics | Rating | Rank | 10th Grade |
| Taiwanese | 0.3 /100 | #267 | Tragic 92.5% |
| Immigrants | Ghana | 0.3 /100 | #268 | Tragic 92.5% |
| Immigrants | Colombia | 0.3 /100 | #269 | Tragic 92.5% |
| Immigrants | Uruguay | 0.3 /100 | #270 | Tragic 92.5% |
| Immigrants | Eritrea | 0.3 /100 | #271 | Tragic 92.5% |
| Immigrants | Western Africa | 0.3 /100 | #272 | Tragic 92.5% |
| Trinidadians and Tobagonians | 0.2 /100 | #273 | Tragic 92.4% |
| Immigrants | Congo | 0.2 /100 | #274 | Tragic 92.4% |
| West Indians | 0.2 /100 | #275 | Tragic 92.4% |
| Immigrants | Trinidad and Tobago | 0.1 /100 | #276 | Tragic 92.3% |
| Navajo | 0.1 /100 | #277 | Tragic 92.3% |
| Barbadians | 0.1 /100 | #278 | Tragic 92.2% |
| Natives/Alaskans | 0.1 /100 | #279 | Tragic 92.2% |
| Malaysians | 0.1 /100 | #280 | Tragic 92.2% |
| Bangladeshis | 0.1 /100 | #281 | Tragic 92.2% |