Asian vs Russian 10th Grade
COMPARE
Asian
Russian
10th Grade
10th Grade Comparison
Asians
Russians
93.5%
10TH GRADE
23.0/ 100
METRIC RATING
199th/ 347
METRIC RANK
95.2%
10TH GRADE
99.9/ 100
METRIC RATING
41st/ 347
METRIC RANK
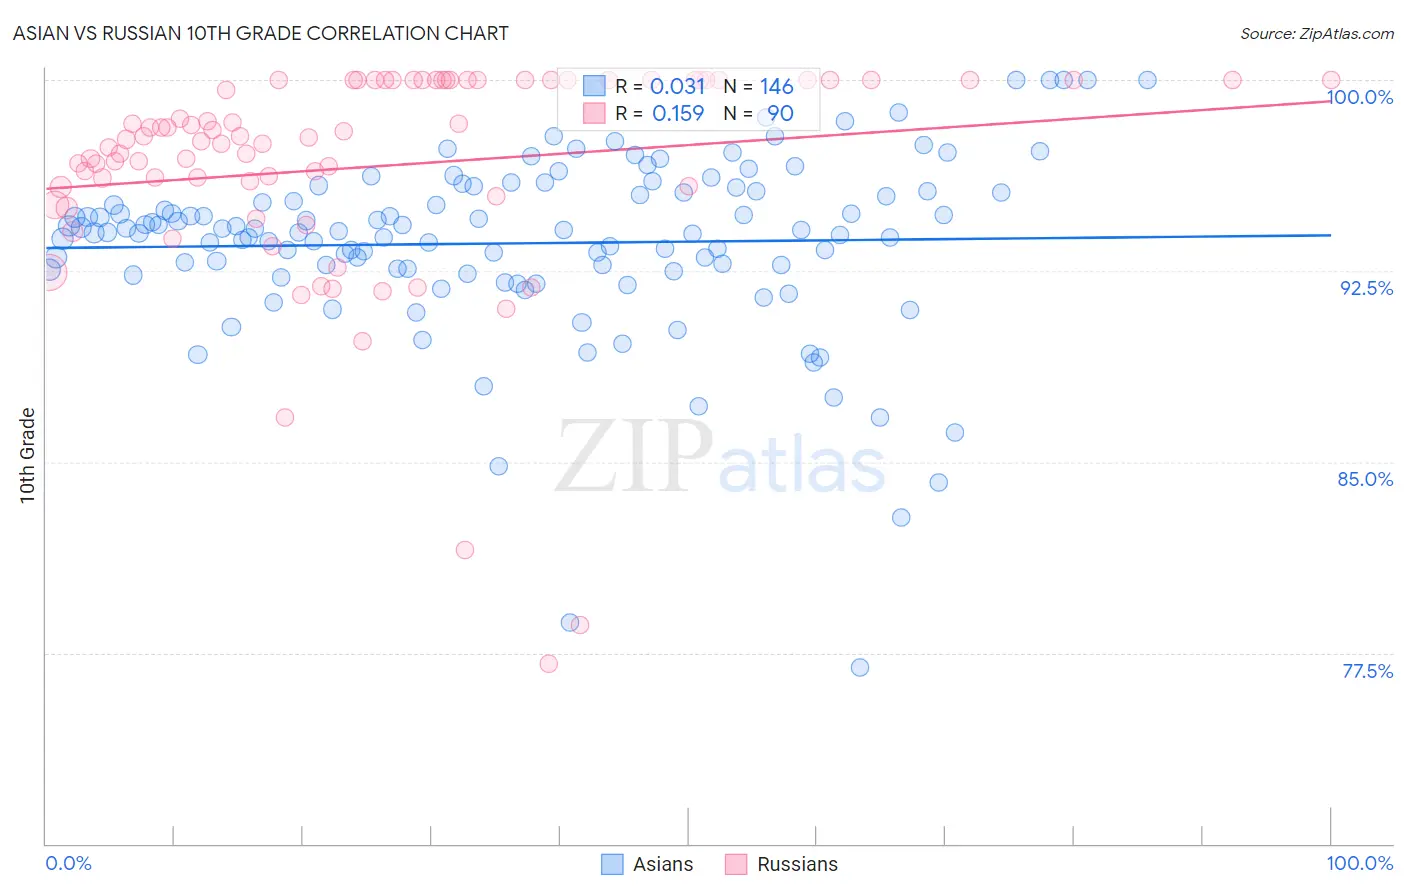
Asian vs Russian 10th Grade Correlation Chart
The statistical analysis conducted on geographies consisting of 550,778,127 people shows no correlation between the proportion of Asians and percentage of population with at least 10th grade education in the United States with a correlation coefficient (R) of 0.031 and weighted average of 93.5%. Similarly, the statistical analysis conducted on geographies consisting of 512,259,033 people shows a poor positive correlation between the proportion of Russians and percentage of population with at least 10th grade education in the United States with a correlation coefficient (R) of 0.159 and weighted average of 95.2%, a difference of 1.8%.
10th Grade Correlation Summary
| Measurement | Asian | Russian |
| Minimum | 76.9% | 77.1% |
| Maximum | 100.0% | 100.0% |
| Range | 23.1% | 22.9% |
| Mean | 93.6% | 96.6% |
| Median | 94.0% | 97.7% |
| Interquartile 25% (IQ1) | 92.5% | 95.8% |
| Interquartile 75% (IQ3) | 95.6% | 100.0% |
| Interquartile Range (IQR) | 3.1% | 4.2% |
| Standard Deviation (Sample) | 3.5% | 4.4% |
| Standard Deviation (Population) | 3.5% | 4.4% |
Similar Demographics by 10th Grade
Demographics Similar to Asians by 10th Grade
In terms of 10th grade, the demographic groups most similar to Asians are Immigrants from Micronesia (93.5%, a difference of 0.0%), Pueblo (93.5%, a difference of 0.010%), Hopi (93.5%, a difference of 0.010%), Hawaiian (93.5%, a difference of 0.020%), and Moroccan (93.5%, a difference of 0.030%).
| Demographics | Rating | Rank | 10th Grade |
| Immigrants | Malaysia | 28.0 /100 | #192 | Fair 93.5% |
| Panamanians | 28.0 /100 | #193 | Fair 93.5% |
| Immigrants | Morocco | 26.9 /100 | #194 | Fair 93.5% |
| Cheyenne | 26.8 /100 | #195 | Fair 93.5% |
| Moroccans | 25.3 /100 | #196 | Fair 93.5% |
| Pueblo | 23.9 /100 | #197 | Fair 93.5% |
| Immigrants | Micronesia | 23.2 /100 | #198 | Fair 93.5% |
| Asians | 23.0 /100 | #199 | Fair 93.5% |
| Hopi | 22.2 /100 | #200 | Fair 93.5% |
| Hawaiians | 21.8 /100 | #201 | Fair 93.5% |
| Immigrants | Uganda | 20.9 /100 | #202 | Fair 93.5% |
| Immigrants | Western Asia | 20.6 /100 | #203 | Fair 93.4% |
| Ute | 20.3 /100 | #204 | Fair 93.4% |
| Immigrants | Indonesia | 20.2 /100 | #205 | Fair 93.4% |
| Immigrants | Sudan | 20.0 /100 | #206 | Fair 93.4% |
Demographics Similar to Russians by 10th Grade
In terms of 10th grade, the demographic groups most similar to Russians are Scotch-Irish (95.2%, a difference of 0.020%), Immigrants from Scotland (95.2%, a difference of 0.030%), Slavic (95.2%, a difference of 0.030%), Northern European (95.3%, a difference of 0.050%), and Macedonian (95.2%, a difference of 0.050%).
| Demographics | Rating | Rank | 10th Grade |
| British | 99.9 /100 | #34 | Exceptional 95.3% |
| Estonians | 99.9 /100 | #35 | Exceptional 95.3% |
| Immigrants | India | 99.9 /100 | #36 | Exceptional 95.3% |
| French Canadians | 99.9 /100 | #37 | Exceptional 95.3% |
| Northern Europeans | 99.9 /100 | #38 | Exceptional 95.3% |
| Immigrants | Scotland | 99.9 /100 | #39 | Exceptional 95.2% |
| Scotch-Irish | 99.9 /100 | #40 | Exceptional 95.2% |
| Russians | 99.9 /100 | #41 | Exceptional 95.2% |
| Slavs | 99.9 /100 | #42 | Exceptional 95.2% |
| Macedonians | 99.9 /100 | #43 | Exceptional 95.2% |
| Immigrants | Northern Europe | 99.9 /100 | #44 | Exceptional 95.2% |
| Greeks | 99.9 /100 | #45 | Exceptional 95.2% |
| Czechoslovakians | 99.9 /100 | #46 | Exceptional 95.1% |
| Serbians | 99.9 /100 | #47 | Exceptional 95.1% |
| Australians | 99.9 /100 | #48 | Exceptional 95.1% |