Turkish vs Immigrants from Fiji 10th Grade
COMPARE
Turkish
Immigrants from Fiji
10th Grade
10th Grade Comparison
Turks
Immigrants from Fiji
95.0%
10TH GRADE
99.7/ 100
METRIC RATING
65th/ 347
METRIC RANK
91.0%
10TH GRADE
0.0/ 100
METRIC RATING
307th/ 347
METRIC RANK
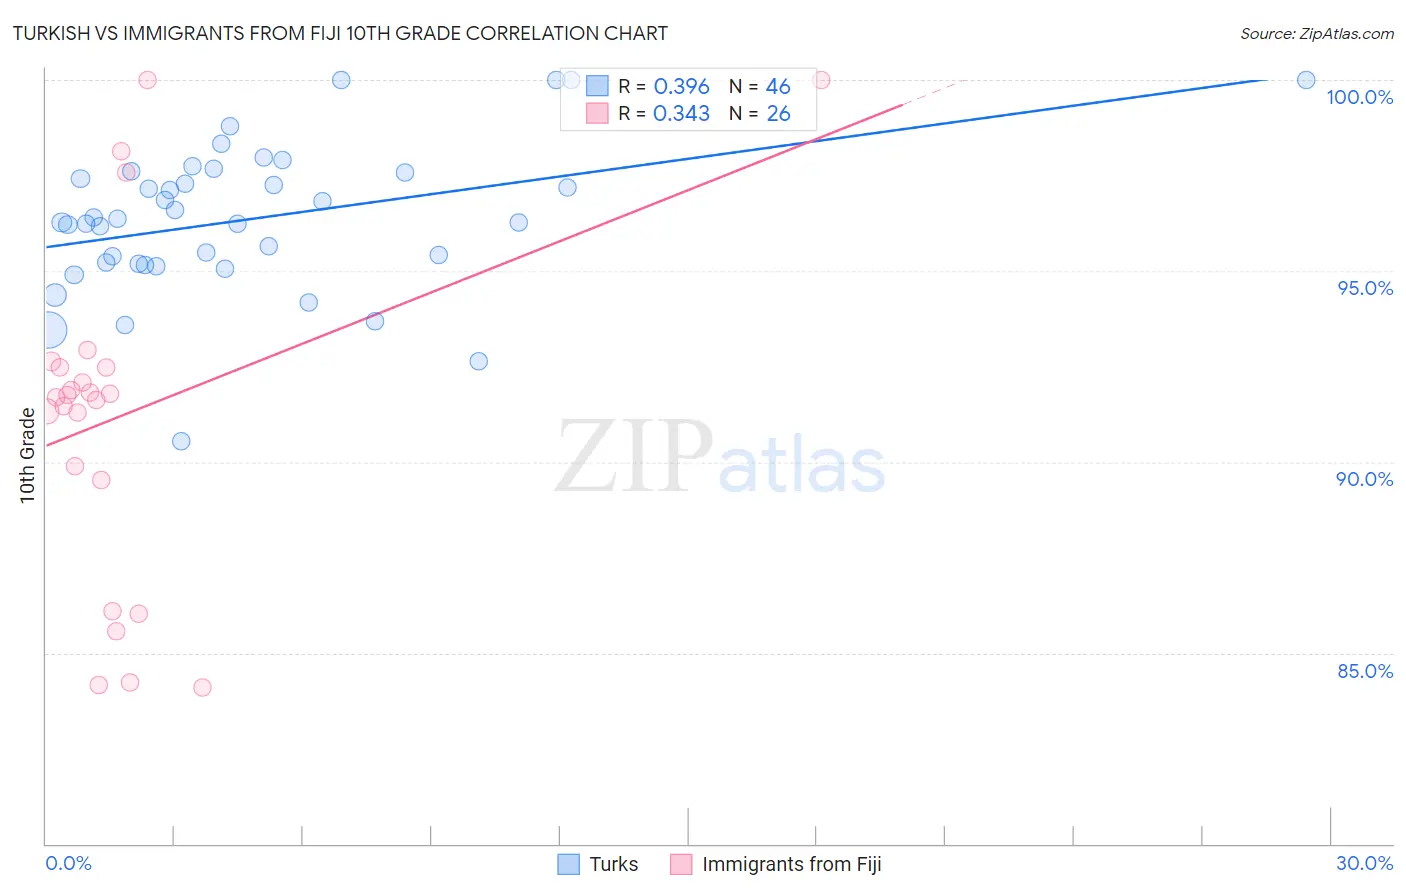
Turkish vs Immigrants from Fiji 10th Grade Correlation Chart
The statistical analysis conducted on geographies consisting of 271,830,524 people shows a mild positive correlation between the proportion of Turks and percentage of population with at least 10th grade education in the United States with a correlation coefficient (R) of 0.396 and weighted average of 95.0%. Similarly, the statistical analysis conducted on geographies consisting of 93,756,204 people shows a mild positive correlation between the proportion of Immigrants from Fiji and percentage of population with at least 10th grade education in the United States with a correlation coefficient (R) of 0.343 and weighted average of 91.0%, a difference of 4.3%.
10th Grade Correlation Summary
| Measurement | Turkish | Immigrants from Fiji |
| Minimum | 90.5% | 84.1% |
| Maximum | 100.0% | 100.0% |
| Range | 9.5% | 15.9% |
| Mean | 96.4% | 91.2% |
| Median | 96.3% | 91.7% |
| Interquartile 25% (IQ1) | 95.2% | 89.5% |
| Interquartile 75% (IQ3) | 97.6% | 92.5% |
| Interquartile Range (IQR) | 2.4% | 2.9% |
| Standard Deviation (Sample) | 2.0% | 4.4% |
| Standard Deviation (Population) | 1.9% | 4.4% |
Similar Demographics by 10th Grade
Demographics Similar to Turks by 10th Grade
In terms of 10th grade, the demographic groups most similar to Turks are Native Hawaiian (95.0%, a difference of 0.010%), Immigrants from Singapore (95.0%, a difference of 0.020%), Cypriot (95.0%, a difference of 0.030%), Chippewa (95.0%, a difference of 0.030%), and Thai (95.0%, a difference of 0.030%).
| Demographics | Rating | Rank | 10th Grade |
| Aleuts | 99.8 /100 | #58 | Exceptional 95.0% |
| Celtics | 99.8 /100 | #59 | Exceptional 95.0% |
| Cypriots | 99.8 /100 | #60 | Exceptional 95.0% |
| Chippewa | 99.8 /100 | #61 | Exceptional 95.0% |
| Thais | 99.8 /100 | #62 | Exceptional 95.0% |
| Immigrants | Singapore | 99.8 /100 | #63 | Exceptional 95.0% |
| Native Hawaiians | 99.7 /100 | #64 | Exceptional 95.0% |
| Turks | 99.7 /100 | #65 | Exceptional 95.0% |
| Immigrants | Australia | 99.7 /100 | #66 | Exceptional 94.9% |
| Immigrants | Netherlands | 99.7 /100 | #67 | Exceptional 94.9% |
| Immigrants | Belgium | 99.7 /100 | #68 | Exceptional 94.9% |
| Immigrants | England | 99.6 /100 | #69 | Exceptional 94.9% |
| Zimbabweans | 99.6 /100 | #70 | Exceptional 94.9% |
| Alaska Natives | 99.6 /100 | #71 | Exceptional 94.9% |
| Immigrants | Sweden | 99.6 /100 | #72 | Exceptional 94.9% |
Demographics Similar to Immigrants from Fiji by 10th Grade
In terms of 10th grade, the demographic groups most similar to Immigrants from Fiji are Immigrants from Bangladesh (91.0%, a difference of 0.010%), Immigrants (91.0%, a difference of 0.050%), Yaqui (91.1%, a difference of 0.060%), Vietnamese (90.9%, a difference of 0.090%), and Immigrants from Cambodia (90.9%, a difference of 0.11%).
| Demographics | Rating | Rank | 10th Grade |
| Guyanese | 0.0 /100 | #300 | Tragic 91.4% |
| Japanese | 0.0 /100 | #301 | Tragic 91.2% |
| Immigrants | Guyana | 0.0 /100 | #302 | Tragic 91.2% |
| Immigrants | Vietnam | 0.0 /100 | #303 | Tragic 91.2% |
| Pima | 0.0 /100 | #304 | Tragic 91.2% |
| Immigrants | Dominica | 0.0 /100 | #305 | Tragic 91.1% |
| Yaqui | 0.0 /100 | #306 | Tragic 91.1% |
| Immigrants | Fiji | 0.0 /100 | #307 | Tragic 91.0% |
| Immigrants | Bangladesh | 0.0 /100 | #308 | Tragic 91.0% |
| Immigrants | Immigrants | 0.0 /100 | #309 | Tragic 91.0% |
| Vietnamese | 0.0 /100 | #310 | Tragic 90.9% |
| Immigrants | Cambodia | 0.0 /100 | #311 | Tragic 90.9% |
| Immigrants | Portugal | 0.0 /100 | #312 | Tragic 90.8% |
| Cape Verdeans | 0.0 /100 | #313 | Tragic 90.8% |
| Nepalese | 0.0 /100 | #314 | Tragic 90.7% |