Turkish vs Immigrants from Laos Bachelor's Degree
COMPARE
Turkish
Immigrants from Laos
Bachelor's Degree
Bachelor's Degree Comparison
Turks
Immigrants from Laos
46.2%
BACHELOR'S DEGREE
100.0/ 100
METRIC RATING
28th/ 347
METRIC RANK
31.6%
BACHELOR'S DEGREE
0.1/ 100
METRIC RATING
280th/ 347
METRIC RANK
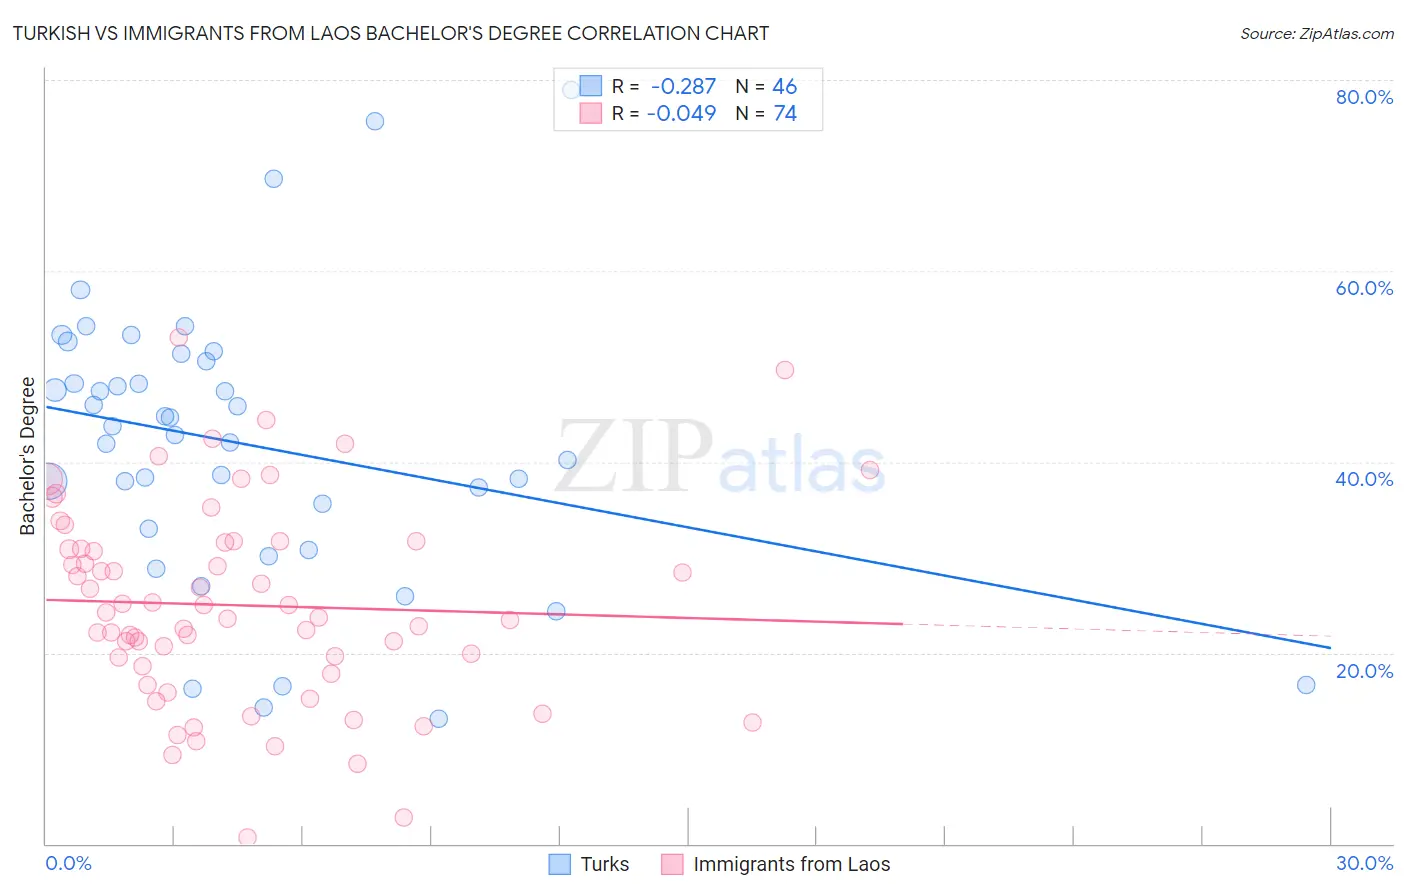
Turkish vs Immigrants from Laos Bachelor's Degree Correlation Chart
The statistical analysis conducted on geographies consisting of 271,847,696 people shows a weak negative correlation between the proportion of Turks and percentage of population with at least bachelor's degree education in the United States with a correlation coefficient (R) of -0.287 and weighted average of 46.2%. Similarly, the statistical analysis conducted on geographies consisting of 201,474,630 people shows no correlation between the proportion of Immigrants from Laos and percentage of population with at least bachelor's degree education in the United States with a correlation coefficient (R) of -0.049 and weighted average of 31.6%, a difference of 46.1%.
Bachelor's Degree Correlation Summary
| Measurement | Turkish | Immigrants from Laos |
| Minimum | 13.1% | 0.64% |
| Maximum | 78.9% | 53.0% |
| Range | 65.8% | 52.4% |
| Mean | 41.8% | 25.0% |
| Median | 43.3% | 24.0% |
| Interquartile 25% (IQ1) | 33.0% | 18.6% |
| Interquartile 75% (IQ3) | 50.5% | 31.5% |
| Interquartile Range (IQR) | 17.5% | 12.9% |
| Standard Deviation (Sample) | 14.7% | 10.5% |
| Standard Deviation (Population) | 14.5% | 10.4% |
Similar Demographics by Bachelor's Degree
Demographics Similar to Turks by Bachelor's Degree
In terms of bachelor's degree, the demographic groups most similar to Turks are Israeli (46.1%, a difference of 0.13%), Immigrants from Sri Lanka (46.1%, a difference of 0.18%), Latvian (46.1%, a difference of 0.22%), Immigrants from France (46.4%, a difference of 0.46%), and Immigrants from Turkey (46.0%, a difference of 0.52%).
| Demographics | Rating | Rank | Bachelor's Degree |
| Immigrants | Ireland | 100.0 /100 | #21 | Exceptional 47.1% |
| Immigrants | Belgium | 100.0 /100 | #22 | Exceptional 47.0% |
| Immigrants | Sweden | 100.0 /100 | #23 | Exceptional 47.0% |
| Immigrants | Korea | 100.0 /100 | #24 | Exceptional 47.0% |
| Burmese | 100.0 /100 | #25 | Exceptional 46.9% |
| Immigrants | Japan | 100.0 /100 | #26 | Exceptional 46.8% |
| Immigrants | France | 100.0 /100 | #27 | Exceptional 46.4% |
| Turks | 100.0 /100 | #28 | Exceptional 46.2% |
| Israelis | 100.0 /100 | #29 | Exceptional 46.1% |
| Immigrants | Sri Lanka | 100.0 /100 | #30 | Exceptional 46.1% |
| Latvians | 100.0 /100 | #31 | Exceptional 46.1% |
| Immigrants | Turkey | 100.0 /100 | #32 | Exceptional 46.0% |
| Immigrants | Northern Europe | 100.0 /100 | #33 | Exceptional 45.6% |
| Immigrants | Denmark | 100.0 /100 | #34 | Exceptional 45.4% |
| Immigrants | Russia | 100.0 /100 | #35 | Exceptional 45.4% |
Demographics Similar to Immigrants from Laos by Bachelor's Degree
In terms of bachelor's degree, the demographic groups most similar to Immigrants from Laos are Hawaiian (31.6%, a difference of 0.050%), Marshallese (31.7%, a difference of 0.40%), Dominican (31.8%, a difference of 0.45%), Blackfeet (31.5%, a difference of 0.46%), and Salvadoran (31.8%, a difference of 0.60%).
| Demographics | Rating | Rank | Bachelor's Degree |
| Americans | 0.2 /100 | #273 | Tragic 31.9% |
| Potawatomi | 0.2 /100 | #274 | Tragic 31.9% |
| Samoans | 0.1 /100 | #275 | Tragic 31.8% |
| Salvadorans | 0.1 /100 | #276 | Tragic 31.8% |
| Dominicans | 0.1 /100 | #277 | Tragic 31.8% |
| Marshallese | 0.1 /100 | #278 | Tragic 31.7% |
| Hawaiians | 0.1 /100 | #279 | Tragic 31.6% |
| Immigrants | Laos | 0.1 /100 | #280 | Tragic 31.6% |
| Blackfeet | 0.1 /100 | #281 | Tragic 31.5% |
| Immigrants | Caribbean | 0.1 /100 | #282 | Tragic 31.4% |
| Hondurans | 0.1 /100 | #283 | Tragic 31.3% |
| Haitians | 0.1 /100 | #284 | Tragic 31.3% |
| Aleuts | 0.1 /100 | #285 | Tragic 31.3% |
| Immigrants | El Salvador | 0.1 /100 | #286 | Tragic 31.3% |
| Ottawa | 0.1 /100 | #287 | Tragic 31.1% |