Turkish vs Immigrants from Sierra Leone Single Father Poverty
COMPARE
Turkish
Immigrants from Sierra Leone
Single Father Poverty
Single Father Poverty Comparison
Turks
Immigrants from Sierra Leone
15.8%
SINGLE FATHER POVERTY
95.1/ 100
METRIC RATING
109th/ 347
METRIC RANK
16.3%
SINGLE FATHER POVERTY
50.1/ 100
METRIC RATING
172nd/ 347
METRIC RANK
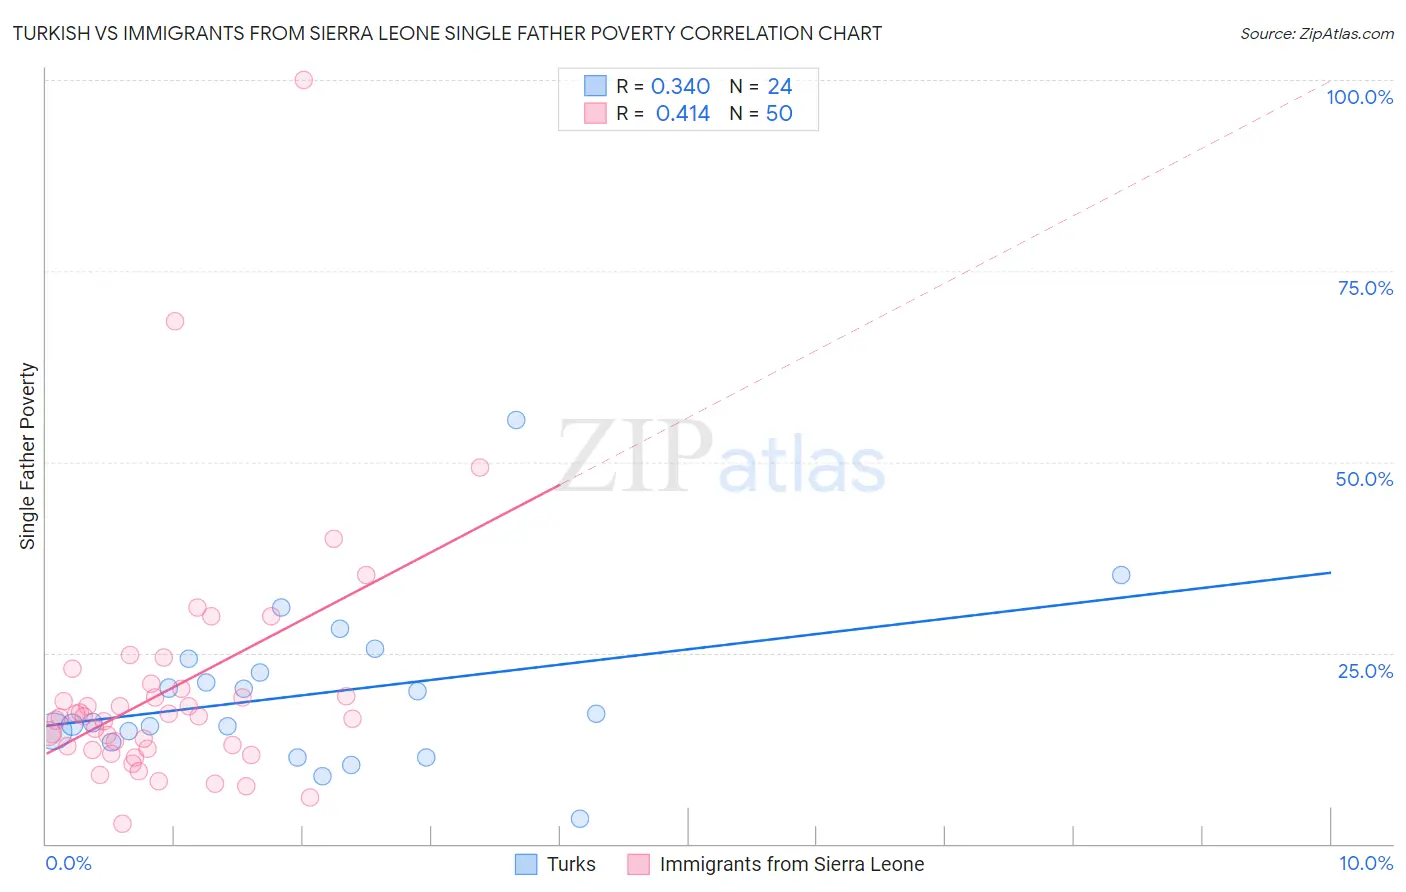
Turkish vs Immigrants from Sierra Leone Single Father Poverty Correlation Chart
The statistical analysis conducted on geographies consisting of 218,864,079 people shows a mild positive correlation between the proportion of Turks and poverty level among single fathers in the United States with a correlation coefficient (R) of 0.340 and weighted average of 15.8%. Similarly, the statistical analysis conducted on geographies consisting of 92,656,133 people shows a moderate positive correlation between the proportion of Immigrants from Sierra Leone and poverty level among single fathers in the United States with a correlation coefficient (R) of 0.414 and weighted average of 16.3%, a difference of 3.4%.
Single Father Poverty Correlation Summary
| Measurement | Turkish | Immigrants from Sierra Leone |
| Minimum | 3.3% | 2.7% |
| Maximum | 55.4% | 100.0% |
| Range | 52.1% | 97.3% |
| Mean | 19.6% | 20.2% |
| Median | 16.4% | 16.6% |
| Interquartile 25% (IQ1) | 14.0% | 12.4% |
| Interquartile 75% (IQ3) | 23.4% | 20.3% |
| Interquartile Range (IQR) | 9.4% | 7.9% |
| Standard Deviation (Sample) | 10.5% | 16.0% |
| Standard Deviation (Population) | 10.3% | 15.9% |
Similar Demographics by Single Father Poverty
Demographics Similar to Turks by Single Father Poverty
In terms of single father poverty, the demographic groups most similar to Turks are Immigrants from Africa (15.8%, a difference of 0.010%), Bulgarian (15.8%, a difference of 0.060%), Immigrants from Latvia (15.8%, a difference of 0.090%), Danish (15.8%, a difference of 0.14%), and Argentinean (15.8%, a difference of 0.15%).
| Demographics | Rating | Rank | Single Father Poverty |
| Chileans | 96.4 /100 | #102 | Exceptional 15.7% |
| South American Indians | 96.2 /100 | #103 | Exceptional 15.7% |
| Australians | 96.1 /100 | #104 | Exceptional 15.7% |
| Immigrants | Australia | 96.1 /100 | #105 | Exceptional 15.7% |
| Immigrants | Poland | 95.8 /100 | #106 | Exceptional 15.7% |
| Native Hawaiians | 95.8 /100 | #107 | Exceptional 15.7% |
| Pakistanis | 95.7 /100 | #108 | Exceptional 15.7% |
| Turks | 95.1 /100 | #109 | Exceptional 15.8% |
| Immigrants | Africa | 95.1 /100 | #110 | Exceptional 15.8% |
| Bulgarians | 94.8 /100 | #111 | Exceptional 15.8% |
| Immigrants | Latvia | 94.7 /100 | #112 | Exceptional 15.8% |
| Danes | 94.5 /100 | #113 | Exceptional 15.8% |
| Argentineans | 94.4 /100 | #114 | Exceptional 15.8% |
| Immigrants | Thailand | 93.6 /100 | #115 | Exceptional 15.8% |
| Immigrants | Argentina | 92.8 /100 | #116 | Exceptional 15.8% |
Demographics Similar to Immigrants from Sierra Leone by Single Father Poverty
In terms of single father poverty, the demographic groups most similar to Immigrants from Sierra Leone are Immigrants from St. Vincent and the Grenadines (16.3%, a difference of 0.0%), Swedish (16.3%, a difference of 0.0%), Immigrants from Ecuador (16.3%, a difference of 0.020%), Immigrants from Morocco (16.3%, a difference of 0.030%), and Vietnamese (16.3%, a difference of 0.090%).
| Demographics | Rating | Rank | Single Father Poverty |
| Immigrants | Bangladesh | 55.1 /100 | #165 | Average 16.3% |
| Immigrants | Europe | 54.8 /100 | #166 | Average 16.3% |
| Yugoslavians | 53.9 /100 | #167 | Average 16.3% |
| Costa Ricans | 53.6 /100 | #168 | Average 16.3% |
| Northern Europeans | 52.8 /100 | #169 | Average 16.3% |
| Scandinavians | 52.3 /100 | #170 | Average 16.3% |
| Immigrants | Morocco | 50.7 /100 | #171 | Average 16.3% |
| Immigrants | Sierra Leone | 50.1 /100 | #172 | Average 16.3% |
| Immigrants | St. Vincent and the Grenadines | 50.0 /100 | #173 | Average 16.3% |
| Swedes | 50.0 /100 | #174 | Average 16.3% |
| Immigrants | Ecuador | 49.7 /100 | #175 | Average 16.3% |
| Vietnamese | 48.0 /100 | #176 | Average 16.3% |
| Immigrants | South Africa | 44.2 /100 | #177 | Average 16.3% |
| Immigrants | Cuba | 41.6 /100 | #178 | Average 16.4% |
| Serbians | 40.9 /100 | #179 | Average 16.4% |