Indonesian vs Immigrants from Sierra Leone Professional Degree
COMPARE
Indonesian
Immigrants from Sierra Leone
Professional Degree
Professional Degree Comparison
Indonesians
Immigrants from Sierra Leone
3.7%
PROFESSIONAL DEGREE
1.0/ 100
METRIC RATING
260th/ 347
METRIC RANK
4.5%
PROFESSIONAL DEGREE
58.7/ 100
METRIC RATING
168th/ 347
METRIC RANK
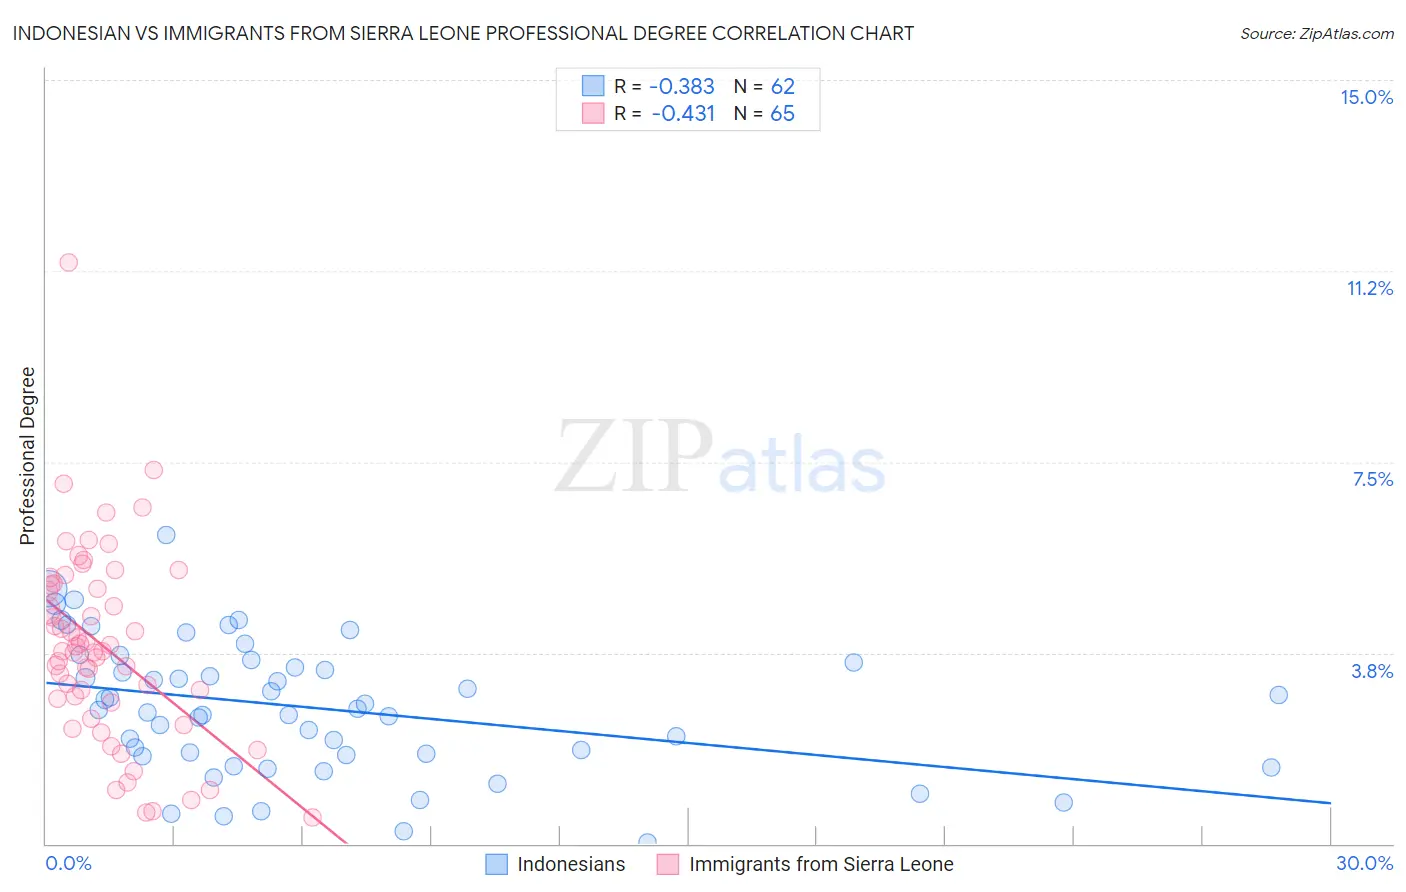
Indonesian vs Immigrants from Sierra Leone Professional Degree Correlation Chart
The statistical analysis conducted on geographies consisting of 162,566,642 people shows a mild negative correlation between the proportion of Indonesians and percentage of population with at least professional degree education in the United States with a correlation coefficient (R) of -0.383 and weighted average of 3.7%. Similarly, the statistical analysis conducted on geographies consisting of 101,572,134 people shows a moderate negative correlation between the proportion of Immigrants from Sierra Leone and percentage of population with at least professional degree education in the United States with a correlation coefficient (R) of -0.431 and weighted average of 4.5%, a difference of 21.6%.
Professional Degree Correlation Summary
| Measurement | Indonesian | Immigrants from Sierra Leone |
| Minimum | 0.034% | 0.52% |
| Maximum | 6.1% | 11.4% |
| Range | 6.0% | 10.9% |
| Mean | 2.7% | 3.9% |
| Median | 2.6% | 3.8% |
| Interquartile 25% (IQ1) | 1.7% | 2.8% |
| Interquartile 75% (IQ3) | 3.6% | 5.1% |
| Interquartile Range (IQR) | 1.8% | 2.3% |
| Standard Deviation (Sample) | 1.3% | 1.9% |
| Standard Deviation (Population) | 1.3% | 1.9% |
Similar Demographics by Professional Degree
Demographics Similar to Indonesians by Professional Degree
In terms of professional degree, the demographic groups most similar to Indonesians are African (3.7%, a difference of 0.010%), Immigrants from Guyana (3.7%, a difference of 0.18%), U.S. Virgin Islander (3.7%, a difference of 0.19%), Immigrants from St. Vincent and the Grenadines (3.7%, a difference of 0.23%), and Bahamian (3.7%, a difference of 0.31%).
| Demographics | Rating | Rank | Professional Degree |
| Pueblo | 1.4 /100 | #253 | Tragic 3.7% |
| Tongans | 1.3 /100 | #254 | Tragic 3.7% |
| Osage | 1.2 /100 | #255 | Tragic 3.7% |
| Iroquois | 1.2 /100 | #256 | Tragic 3.7% |
| Bahamians | 1.1 /100 | #257 | Tragic 3.7% |
| Immigrants | St. Vincent and the Grenadines | 1.1 /100 | #258 | Tragic 3.7% |
| Africans | 1.0 /100 | #259 | Tragic 3.7% |
| Indonesians | 1.0 /100 | #260 | Tragic 3.7% |
| Immigrants | Guyana | 1.0 /100 | #261 | Tragic 3.7% |
| U.S. Virgin Islanders | 1.0 /100 | #262 | Tragic 3.7% |
| Hopi | 0.9 /100 | #263 | Tragic 3.6% |
| Immigrants | Cambodia | 0.9 /100 | #264 | Tragic 3.6% |
| Immigrants | Congo | 0.8 /100 | #265 | Tragic 3.6% |
| Central American Indians | 0.8 /100 | #266 | Tragic 3.6% |
| Delaware | 0.7 /100 | #267 | Tragic 3.6% |
Demographics Similar to Immigrants from Sierra Leone by Professional Degree
In terms of professional degree, the demographic groups most similar to Immigrants from Sierra Leone are Chinese (4.5%, a difference of 0.020%), Immigrants from Afghanistan (4.5%, a difference of 0.070%), Immigrants from Colombia (4.5%, a difference of 0.10%), Costa Rican (4.5%, a difference of 0.17%), and Immigrants from Zaire (4.5%, a difference of 0.19%).
| Demographics | Rating | Rank | Professional Degree |
| Assyrians/Chaldeans/Syriacs | 67.4 /100 | #161 | Good 4.5% |
| Peruvians | 65.2 /100 | #162 | Good 4.5% |
| Sierra Leoneans | 64.3 /100 | #163 | Good 4.5% |
| Swiss | 61.0 /100 | #164 | Good 4.5% |
| Costa Ricans | 59.9 /100 | #165 | Average 4.5% |
| Immigrants | Colombia | 59.4 /100 | #166 | Average 4.5% |
| Immigrants | Afghanistan | 59.2 /100 | #167 | Average 4.5% |
| Immigrants | Sierra Leone | 58.7 /100 | #168 | Average 4.5% |
| Chinese | 58.6 /100 | #169 | Average 4.5% |
| Immigrants | Zaire | 57.4 /100 | #170 | Average 4.5% |
| Immigrants | Bangladesh | 56.0 /100 | #171 | Average 4.4% |
| Spaniards | 52.0 /100 | #172 | Average 4.4% |
| English | 50.1 /100 | #173 | Average 4.4% |
| Kenyans | 50.0 /100 | #174 | Average 4.4% |
| Irish | 50.0 /100 | #175 | Average 4.4% |