Turkish vs Immigrants from Sierra Leone Disability Age 35 to 64
COMPARE
Turkish
Immigrants from Sierra Leone
Disability Age 35 to 64
Disability Age 35 to 64 Comparison
Turks
Immigrants from Sierra Leone
9.7%
DISABILITY AGE 35 TO 64
99.9/ 100
METRIC RATING
32nd/ 347
METRIC RANK
11.0%
DISABILITY AGE 35 TO 64
76.2/ 100
METRIC RATING
156th/ 347
METRIC RANK
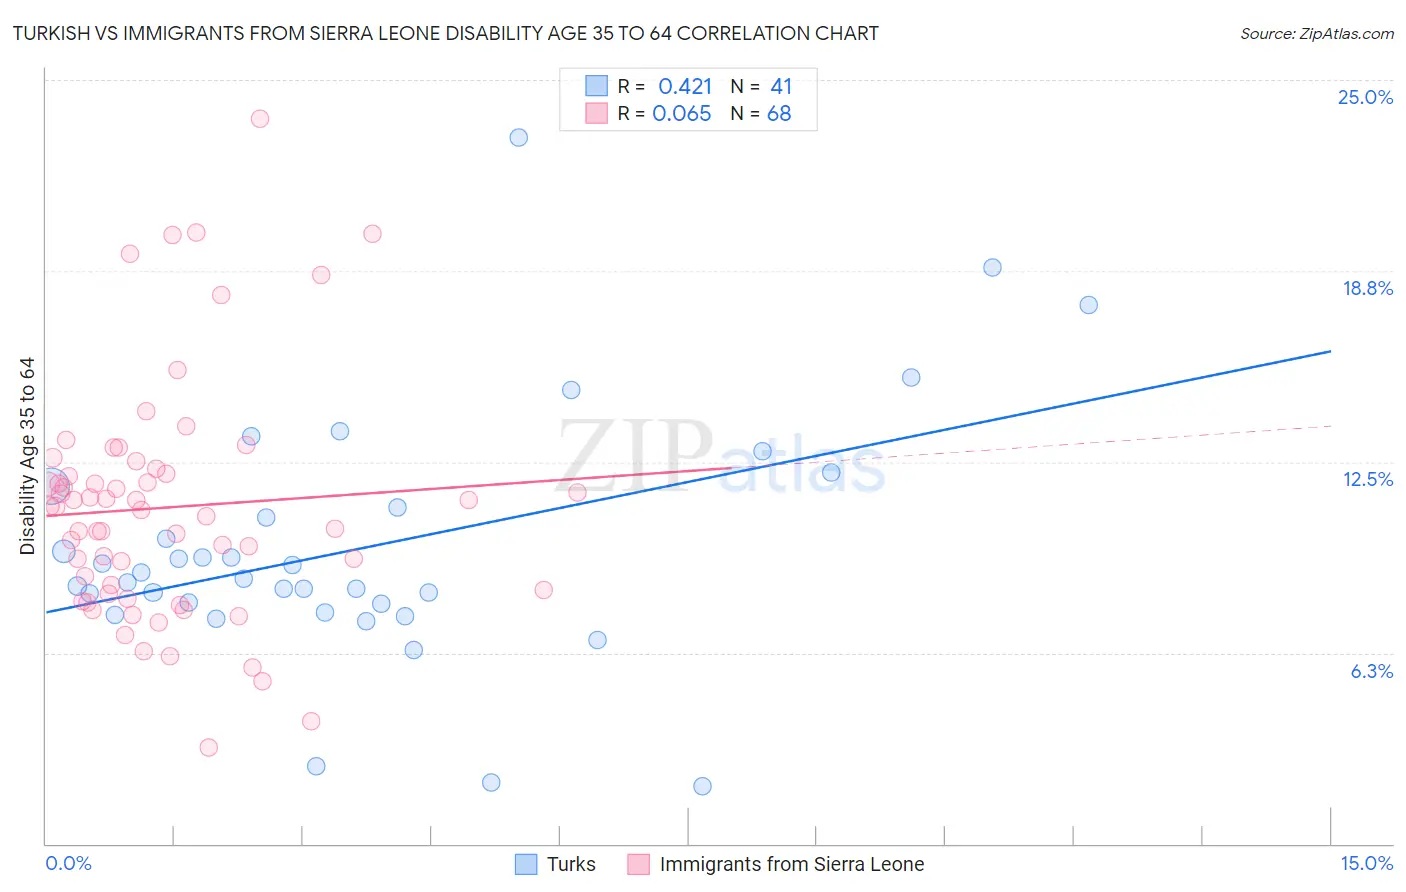
Turkish vs Immigrants from Sierra Leone Disability Age 35 to 64 Correlation Chart
The statistical analysis conducted on geographies consisting of 271,671,610 people shows a moderate positive correlation between the proportion of Turks and percentage of population with a disability between the ages 34 and 64 in the United States with a correlation coefficient (R) of 0.421 and weighted average of 9.7%. Similarly, the statistical analysis conducted on geographies consisting of 101,638,803 people shows a slight positive correlation between the proportion of Immigrants from Sierra Leone and percentage of population with a disability between the ages 34 and 64 in the United States with a correlation coefficient (R) of 0.065 and weighted average of 11.0%, a difference of 14.1%.
Disability Age 35 to 64 Correlation Summary
| Measurement | Turkish | Immigrants from Sierra Leone |
| Minimum | 1.9% | 3.2% |
| Maximum | 23.1% | 23.8% |
| Range | 21.2% | 20.6% |
| Mean | 9.7% | 11.0% |
| Median | 8.7% | 11.0% |
| Interquartile 25% (IQ1) | 7.7% | 8.3% |
| Interquartile 75% (IQ3) | 11.3% | 12.2% |
| Interquartile Range (IQR) | 3.6% | 3.9% |
| Standard Deviation (Sample) | 4.1% | 3.9% |
| Standard Deviation (Population) | 4.1% | 3.9% |
Similar Demographics by Disability Age 35 to 64
Demographics Similar to Turks by Disability Age 35 to 64
In terms of disability age 35 to 64, the demographic groups most similar to Turks are Immigrants from Indonesia (9.7%, a difference of 0.070%), Immigrants from Australia (9.7%, a difference of 0.15%), Bulgarian (9.7%, a difference of 0.25%), Immigrants from Cuba (9.7%, a difference of 0.28%), and Immigrants from Turkey (9.7%, a difference of 0.36%).
| Demographics | Rating | Rank | Disability Age 35 to 64 |
| Venezuelans | 100.0 /100 | #25 | Exceptional 9.4% |
| Immigrants | Sri Lanka | 100.0 /100 | #26 | Exceptional 9.5% |
| Immigrants | Asia | 100.0 /100 | #27 | Exceptional 9.5% |
| Immigrants | Pakistan | 100.0 /100 | #28 | Exceptional 9.5% |
| Immigrants | Ireland | 100.0 /100 | #29 | Exceptional 9.5% |
| Immigrants | Japan | 100.0 /100 | #30 | Exceptional 9.5% |
| Immigrants | Lithuania | 99.9 /100 | #31 | Exceptional 9.6% |
| Turks | 99.9 /100 | #32 | Exceptional 9.7% |
| Immigrants | Indonesia | 99.9 /100 | #33 | Exceptional 9.7% |
| Immigrants | Australia | 99.9 /100 | #34 | Exceptional 9.7% |
| Bulgarians | 99.9 /100 | #35 | Exceptional 9.7% |
| Immigrants | Cuba | 99.9 /100 | #36 | Exceptional 9.7% |
| Immigrants | Turkey | 99.9 /100 | #37 | Exceptional 9.7% |
| Egyptians | 99.9 /100 | #38 | Exceptional 9.7% |
| Immigrants | Belarus | 99.9 /100 | #39 | Exceptional 9.7% |
Demographics Similar to Immigrants from Sierra Leone by Disability Age 35 to 64
In terms of disability age 35 to 64, the demographic groups most similar to Immigrants from Sierra Leone are Moroccan (11.0%, a difference of 0.020%), Immigrants from Canada (11.0%, a difference of 0.060%), Immigrants from England (11.0%, a difference of 0.13%), Guyanese (11.0%, a difference of 0.13%), and Immigrants from North America (11.0%, a difference of 0.14%).
| Demographics | Rating | Rank | Disability Age 35 to 64 |
| Immigrants | Cameroon | 81.1 /100 | #149 | Excellent 10.9% |
| Syrians | 79.8 /100 | #150 | Good 11.0% |
| New Zealanders | 79.3 /100 | #151 | Good 11.0% |
| Ukrainians | 78.0 /100 | #152 | Good 11.0% |
| Immigrants | England | 77.4 /100 | #153 | Good 11.0% |
| Immigrants | Canada | 76.7 /100 | #154 | Good 11.0% |
| Moroccans | 76.4 /100 | #155 | Good 11.0% |
| Immigrants | Sierra Leone | 76.2 /100 | #156 | Good 11.0% |
| Guyanese | 75.1 /100 | #157 | Good 11.0% |
| Immigrants | North America | 74.9 /100 | #158 | Good 11.0% |
| Serbians | 73.6 /100 | #159 | Good 11.0% |
| Croatians | 73.1 /100 | #160 | Good 11.0% |
| Immigrants | Guyana | 70.1 /100 | #161 | Good 11.1% |
| Immigrants | Grenada | 68.4 /100 | #162 | Good 11.1% |
| Immigrants | St. Vincent and the Grenadines | 66.6 /100 | #163 | Good 11.1% |